Content
Published:
This is an archived release.
Higher prices for most goods
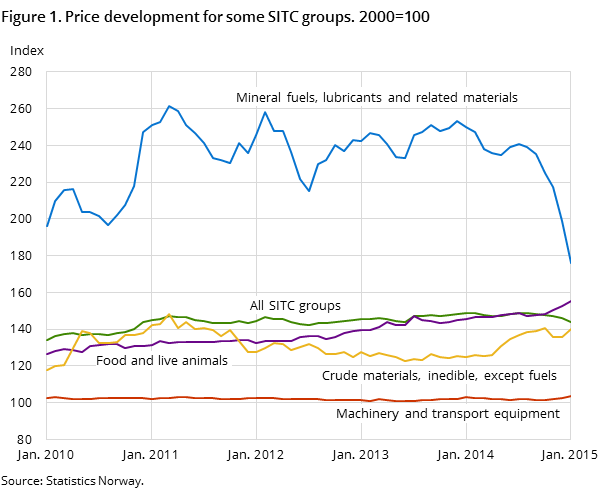
Prices for most groups of goods in the price index for first-hand domestic sales (PIF) increased from December to January. The exception was ‘mineral fuels, lubricants and related materials’, where prices fell by almost 12 per cent. This led to a fall of 1.2 per cent in the overall index.
| Per cent | Per cent | Index | Weights1 | |
|---|---|---|---|---|
| January 2015 / December 2014 | January 2015 / January 2014 | January 2015 | ||
| 1The weights are updated annually, and are valid for the entire year. | ||||
| Product groups | ||||
| Total index | -1.2 | -3.3 | 144.0 | 1 000.0 |
| Food | 1.9 | 6.8 | 155.5 | 192.6 |
| Beverages and tobacco | 0.8 | 1.9 | 158.0 | 14.3 |
| Crude materials, inedible, except fuels | 3.1 | 12.1 | 139.9 | 47.7 |
| Mineral fuels, lubricants and related materials | -11.7 | -29.6 | 175.8 | 218.4 |
| Chemicals and related products, n.e.s. | 0.1 | 2.5 | 153.0 | 65.2 |
| Manufactured goods classified by material | 1.0 | 5.3 | 137.9 | 130.9 |
| Machinery and transport equipment | 1.3 | 0.5 | 103.7 | 229.7 |
| Miscellaneous manufactured articles | 0.9 | 3.4 | 118.0 | 94.6 |

The price index for first-hand domestic sales (PIF) was 144.0 in January (where 2000=100), compared to 145.8 in December, which translates to a decrease of 1.2 per cent.
Higher prices for goods except petroleum products and electricity
The group of goods causing the overall fall in PIF from December to January was ‘mineral fuels, lubricants and related materials’ (which includes electricity). Prices for these fell by almost 12 per cent, due to a continuing decrease in prices of crude oil and petroleum products. The price of electricity fell by 3.2 per cent.
All other main groups of goods in the PIF showed increased prices from December to January. The index for food and live animals grew by 1.9 per cent, mainly due to 7.8 per cent higher prices for fish. The index for ‘crude materials, inedible, except fuels’ increased by 3.1 per cent, as prices for metalliferous ores and metal scrap grew.
Twelve-month rate: 3.3 per cent decline in PIF
Compared with January 2014, the overall PIF was 3.3 per cent lower in the same month this year. Also in this perspective, the fall in prices of oil and petroleum products pulled the index down. Over the twelve months, prices in ‘mineral fuels, lubricants and related materials’ fell by almost 30 per cent. Excluding these goods, the index was 4.5 per cent higher than one year ago. Prices increased in all other main groups of goods. For food and live animals the price growth was 6.8 per cent. Prices of fish and meat were 4 and 5.1 per cent higher respectively, while stronger price growth for vegetables, fruit, coffee and animal feed brought the index up further.
Prices of ‘crude materials, inedible, except fuels’ were more than 12 per cent higher than in January last year. The increase was due to a strong growth in prices of metalliferous ores and metal scrap in the second quarter of 2014. Higher prices for metals helped bring the index for ‘manufactured goods classified by material’ up 5.3 per cent.
The index for ‘miscellaneous manufactured articles’, which includes many consumer goods, was 3.4 per cent higher than twelve months before due to higher prices for clothing and furniture. In the same period, prices for office machines and data processing machines fell by 7.8 per cent. Meanwhile, the overall index for ‘machinery and transport equipment’ grew by 0.5 per cent due to higher prices for other electrical equipment and road vehicles.
Over the past twelve months, prices have increased more for imported goods than for domestically produced goods sold to Norwegian customers. Import prices have helped raise the index, particularly for food and crude materials.
Updated weights in effect from JanuaryOpen and readClose
The PIF is calculated as a weighted average of price changes. For the index to reflect the current structure of Norwegian production and imports, the weights used in the calculation are updated annually and introduced in the index from January. The weights did not change much from 2014 to 2015, but weights for food, machinery and transport equipment increased, while those for mineral fuels decreased.
The weights are based on output and import values from national accounts. For details on industries’ weights, click the heading “tables” or go to StatBank and extract your own tables.
Additional information
Contact
-
Producer price index
E-mail: produsentpris@ssb.no
tel.: (+47) 21 09 40 00
-
Elisabeth Mælum
E-mail: elisabeth.maelum@ssb.no
tel.: (+47) 97 01 28 49
-
Monika Græsli Engebretsen
E-mail: monika.graesli.engebretsen@ssb.no
tel.: (+47) 40 90 23 71
-
Morten Madshus
E-mail: morten.madshus@ssb.no
tel.: (+47) 40 90 26 94
