Content
Published:
This is an archived release.
Lower prices for most groups of goods
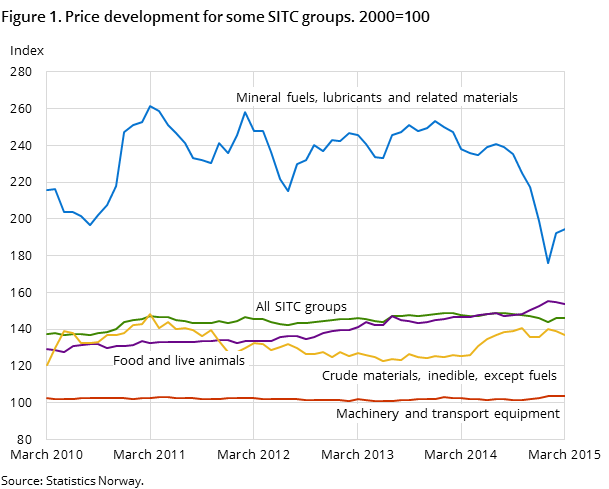
The price index of first-hand domestic sales (PIF) fell by 0.2 per cent from February to March. Prices for most groups of goods decreased, with petroleum products as a key exception. The highest rate of decline was seen for domestically produced goods, while prices for many imported goods increased.
| Per cent | Per cent | Index | Weights1 | |
|---|---|---|---|---|
| March 2015 / February 2015 | March 2015 / March 2014 | March 2015 | ||
| 1The weights are updated annually, and are valid for the entire year. | ||||
| Product groups | ||||
| Total index | -0.2 | -1.1 | 145.9 | 1 000.0 |
| Food | -0.9 | 4.9 | 153.6 | 192.6 |
| Beverages and tobacco | 0.1 | 5.0 | 161.9 | 14.3 |
| Crude materials, inedible, except fuels | -1.5 | 9.1 | 136.7 | 47.7 |
| Mineral fuels, lubricants and related materials | 1.3 | -18.3 | 194.5 | 218.4 |
| Chemicals and related products, n.e.s. | 0.5 | 3.1 | 151.8 | 65.2 |
| Manufactured goods classified by material | -0.5 | 4.4 | 136.9 | 130.9 |
| Machinery and transport equipment | -0.4 | 0.9 | 103.4 | 229.7 |
| Miscellaneous manufactured articles | -0.2 | 2.2 | 118.3 | 94.6 |

The price index for first-hand domestic sales (PIF) was 145.9 in March (where 2000=100), compared to 146.2 in February, which translates to a fall of 0.2 per cent. The decline follows a relatively strong increase of 1.5 per cent in the preceding month. The index for ‘petroleum and petroleum products’ was one of few key sub-groups that increased from February to March. Prices for these goods have rebounded over the past two months, following a severe decline since June last year. The growth was 2.1 per cent from February to March, and 13.7 per cent the preceding month.
Lower prices for food and machinery
One important reason for the overall decline in the index from February to March was that food prices fell by 0.9 per cent. This index has decreased for two consecutive months, following a continuous growth since last summer. The recent fall is mainly due to lower prices for fish.
Another important group of goods where prices fell from February to March was ‘machinery and transport equipment’, where the index fell by 0.4 per cent. The decline was due to lower prices for domestically produced machinery, while prices for imported goods increased.
Increased prices for many goods over past 12 months
Compared with March last year, the index shows a picture that is the opposite of the comparison with February this year: prices for most groups of goods have increased. Again, the group ‘petroleum and petroleum products’ is an exception, and distinguishes itself in this time frame with a relatively large decline in prices. In addition, electricity prices were somewhat lower than in the same month last year. These declining prices led to a fall of 1.1 per cent in the overall index. When the group ‘mineral fuels, lubricants and related materials’ (which also includes electricity) is excluded, the index is 3.7 per cent higher than in March last year.
Key groups of goods with increased prices were food, crude materials and metals. Prices of imported goods in many groups increased more than domestically produced goods. This could be related to a depreciation of the Norwegian krone against several currencies. An import-weighted currency index (the central bank’s so-called I44) indicates a depreciation of about 10 per cent from March 2014 to March this year.
Additional information
Contact
-
Producer price index
E-mail: produsentpris@ssb.no
tel.: (+47) 21 09 40 00
-
Elisabeth Mælum
E-mail: elisabeth.maelum@ssb.no
tel.: (+47) 97 01 28 49
-
Monika Græsli Engebretsen
E-mail: monika.graesli.engebretsen@ssb.no
tel.: (+47) 40 90 23 71
-
Morten Madshus
E-mail: morten.madshus@ssb.no
tel.: (+47) 40 90 26 94
