Content
Published:
This is an archived release.
Highest electricity prices in three years
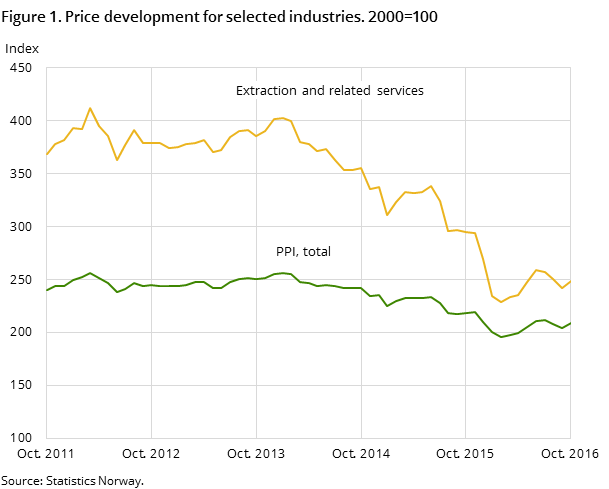
The PPI rose 2.3 per cent from September to October after a decline the two previous months. It was mainly higher prices on electricity and crude oil that contributed to the rise.
| Industrial Classification | Index change in per cent | Index | Weights1 | |
|---|---|---|---|---|
| September 2016 - October 2016 | October 2015 - October 2016 | |||
| 1The weights are updated annually, and are valid for the entire year. | ||||
| Extraction, mining, manufacturing and electricity | 2.3 | -4.5 | 208.8 | 1 000.0 |
| Extraction and related services | 2.6 | -15.9 | 248.1 | 405.4 |
| Mining and quarrying | -1.7 | -1.5 | 174.9 | 7.6 |
| Manufacturing | 0.5 | 1.3 | 160.2 | 544.6 |
| Food products | 1.0 | 6.5 | 179.2 | 117.0 |
| Refined petroleum products | 3.6 | -0.4 | 172.0 | 79.1 |
| Basic metals | -1.4 | -2.2 | 177.4 | 45.7 |
| Machinery and equipment | -0.3 | 3.7 | 158.6 | 59.2 |
| Electricity, gas and steam | 18.6 | 39.3 | 285.9 | 42.4 |


The rise in the PPI was mainly due to higher price of crude oil. The price of natural gas was more or less unchanged. The price of oil was just over 50 $ per barrel through large parts of October, which is a significant increase compared to January when prices were quoted below 30 $ per barrel.
Higher electricity prices
The prices of electricity rose 18.6 per cent from September to October. Electricity prices fluctuate a lot, so monthly price changes of this magnitude are not abnormal. However, the increase led to the highest electricity prices since April 2013.
Decline in the PPI without energy goods
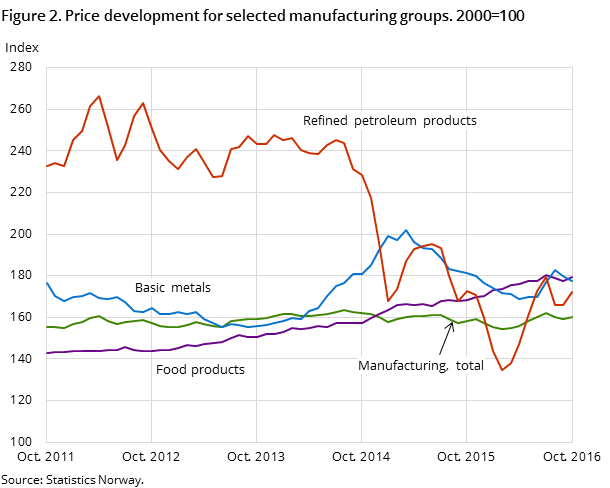
In addition to crude oil and electricity, the prices of refined petroleum products increased as well. Thus it was energy goods that drove the rise in the PPI. If energy goods are excluded, the PPI actually fell by 0.7 per cent. The decrease was to a large extent caused by lower prices on extraction services, where prices mostly have been falling throughout the year.
The price of natural gas pulled down the twelve month change
The twelve month change in the PPI has been negative since June 2014, which must be seen in context with the fall in the price of crude oil that started during the fall of 2014. In October however, the price of oil were higher than twelve months earlier for the first time since July 2014. Nevertheless the total PPI was 4.5 per cent lower in October this year than October last year. This decline was largely due to lower prices on natural gas.
Additional information
Contact
-
Producer price index
E-mail: produsentpris@ssb.no
tel.: (+47) 21 09 40 00
-
Elisabeth Mælum
E-mail: elisabeth.maelum@ssb.no
tel.: (+47) 97 01 28 49
-
Morten Madshus
E-mail: morten.madshus@ssb.no
tel.: (+47) 40 90 26 94
-
Monika Græsli Engebretsen
E-mail: monika.graesli.engebretsen@ssb.no
tel.: (+47) 40 90 23 71
-
Håvard Georg Jensen
E-mail: havard.jensen@ssb.no
tel.: (+47) 40 90 26 86
