Content
Published:
This is an archived release.
High level of GDP, average level of consumption
Norway and Luxembourg have the highest gross domestic product (GDP) in Europe, even when differences in price levels between countries are taken into account. The level of consumption in Norwegian households, however, is similar to that of the 15 EU member countries seen as a whole.
These are among the results from the most recent round of the European Comparison Programme (ECP), which were presented by Eurostat earlier this week. The results are based on data from 31 countries and refer to the years 2000 and 2001. The 2001 results should be regarded as preliminary.
The data on GDP and consumption levels has been adjusted to take account of differences in relative price levels between countries. The indices thus indicate real volumes, not values. The overall picture does not change considerably from 2000 to 2001.
GDP adjusted for price level differences: Luxembourg on top
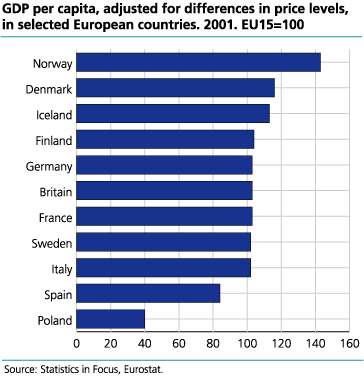
Norway and Luxembourg stand out with a very high GDP per capita. In 2001, Norway's GDP was 43 percent above the EU average, whereas the corresponding figure for Luxembourg was 88 percent. To some extent, the very high level of income in Luxembourg can be explained with reference to the country's high number of employees residing in the neighbouring countries. These contribute to GDP without being part of the resident population. In the case of Norway, the petroleum sector is of great importance.
If we leave Luxembourg aside, the volume of the EU member countries' GDP per capita ranges from 64 percent of the EU average in Greece to 117 percent in Ireland. Other countries well above the average are Denmark, the Netherlands and Austria, as well as EFTA members Iceland and Switzerland. France, Italy, Britain and Germany are close to the average, as are Sweden and Finland. Portugal and Spain, on the other hand, have considerably lower GDP volumes.
Among the ten countries expected to join the EU in 2004, only Cyprus and Slovenia have a level of income similar to that of any current EU member. In the other eight countries, GDP per capita ranges from 33 percent of the EU average in Latvia to 59 percent in the Czech Republic. Results for Malta are not available.
Among all the countries taking part in the European Comparison Programme, Bulgaria, Romania and Turkey have the lowest level of income as measured by GDP volumes. In these countries, GDP per capita is about one quarter of the EU average.
Actual individual consumption and household final consumption expenditure: Norway at the EU average
The final consumption expenditure of households and non-profit institutions serving households (NPISH) basically includes those goods and services which households and NPISH buy and pay for themselves, whereas actual individual consumption also includes goods and services which are provided by government but consumed individually, like health and education services. A typical feature of countries with substantial public welfare arrangements is that the volume index for actual individual consumption will exceed the index for final household and NPISH consumption expenditure.
This can be clearly seen in the volume indices for the Nordic countries. If we consider only the final consumption expenditure of households and NPISH, Norway is at the EU average whereas Denmark and in particular Finland and Sweden have substantially lower volumes of consumption. For actual individual consumption, on the other hand, Norway and Denmark are somewhat above the EU level, and the difference between the EU average and the consumption levels of Sweden and Finland is much less pronounced than for household and NPISH final consumption expenditure.
Among the EU member countries, the by far highest level of actual individual consumption pro capita is found in Luxembourg. The other EU countries range from 69 percent of the EU average in Greece to 112 percent in Britain. The three EFTA countries are somewhat above the average EU level, whereas all EU candidate countries except Cyprus have substantially lower volumes of actual individual consumption.
High price levels in the Nordic countries
The adjustment of GDP and consumption data to take account of differences in relative price levels is based on purchasing power parities (PPPs). These PPPs express, for each participant country, the number of domestic currency units needed in that country in order to maintain the average purchasing power of one euro in the 15 EU member countries. PPPs not only provide a suitable conversion factor in cases where volumes rather than values should be compared between countries with different price levels, but can also be used to calculate indices for the relative price level of each participant country at a given point in time.
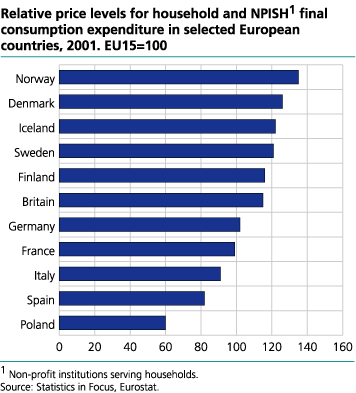
If we look at the final consumption expenditure of households and NPISHs, Norway's relative price level is 35 percent above the EU average. Norway thus has the second highest relative price level in Europe, after Switzerland. Other countries which stand out with a high price level are Denmark, Iceland and Sweden, all of them more than 20 percent above the average for the EU seen as a whole.
Read more in Eurostat 's " Statistics in Focus "
Tables:
- Table 1 Purchasing Power Survey 2000. Volume indices for GDP and private consumption. Final results. EU15=100
- Table 2 Purchasing Power Survey 2001. Volume indices for GDP and private consumption. Preliminary results. EU15=100
- Table 3 Purchasing power parities and price level indices for household and NPISH final consumption expenditure, 2001. Preliminary results
This page has been discontinued, see Comparison of price levels in Europe, Annually.
Additional information
Contact
-
Birte Larsen Sandstå
E-mail: birte.sandsta@ssb.no
tel.: (+47) 92 60 56 03
-
Hamdi A. Mohamed
E-mail: hamdi.mohamed@ssb.no
tel.: (+47) 46 81 54 76
-
Norway-ppp@ssb.no
E-mail: norway-ppp@ssb.no


