Content
Published:
This is an archived release.
Norway with Europe’s highest food prices
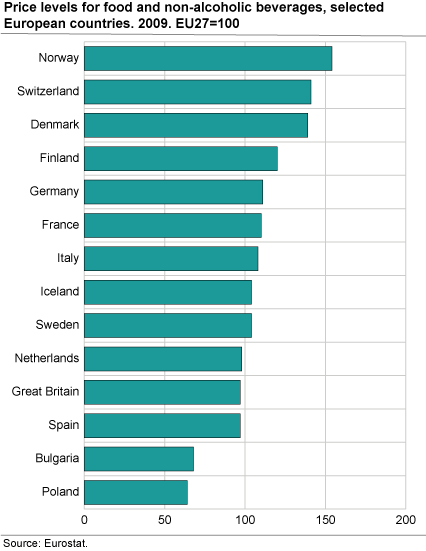
In 2009 Norway had Europe's highest price level for food. “Milk, cheese and eggs” was the relatively most expensive sub-group. Norway was also the most expensive country for alcoholic beverages and tobacco.
In 2009, the Norwegian price level for food and non-alcoholic beverages was 54 per cent above the average price level of the 27 EU member countries (EU27). Switzerland and Denmark followed Norway with indices 41 and 39 per cent respectively above average. Prices for food and non-alcoholic beverages in Sweden were about 32 per cent below the price level in Norway.
Milk, cheese and egg prices particularly high
Norwegian prices are 40-70 per cent above the European average for all sub-groups in the survey, except the sub-group “fish”. “Milk, cheese and eggs” had the highest price level in relative terms; 69 per cent above the EU27 average. The sub-groups “meat” and “fruits, vegetables and potatoes” also had high indices, 62 and 54 per cent above average respectively.
Alcoholic beverages and tobacco: Norway on top
Norway and Ireland stand out with Europe’s highest tobacco prices; 119 and 117 per cent above the EU27 average. In a Nordic perspective, the Swedish price level for tobacco was 41 per cent below Norway, while Denmark and Finland had price levels 47 and 50 per cent below. Norway also comes out on top for the sub-group alcoholic beverages; 134 per cent above the EU27 average.
| Food and non-alcoholic beverages | Milk, cheese and eggs | Meat | Fruits, vegetables, potatoes | Bread and cereals | Fish | Tobacco | Alcoholic beverages | ||||||||||||||||||||||||||||||||||||||||||||||||||||||||||||||||||||||||
|---|---|---|---|---|---|---|---|---|---|---|---|---|---|---|---|---|---|---|---|---|---|---|---|---|---|---|---|---|---|---|---|---|---|---|---|---|---|---|---|---|---|---|---|---|---|---|---|---|---|---|---|---|---|---|---|---|---|---|---|---|---|---|---|---|---|---|---|---|---|---|---|---|---|---|---|---|---|---|---|
| Norway | 154 | 169 | 162 | 154 | 145 | 122 | 219 | 234 | |||||||||||||||||||||||||||||||||||||||||||||||||||||||||||||||||||||||
| Denmark | 139 | 115 | 131 | 134 | 146 | 120 | 117 | 135 | |||||||||||||||||||||||||||||||||||||||||||||||||||||||||||||||||||||||
| Finland | 120 | 111 | 120 | 129 | 128 | 103 | 110 | 170 | |||||||||||||||||||||||||||||||||||||||||||||||||||||||||||||||||||||||
| Germany | 111 | 92 | 126 | 127 | 110 | 109 | 119 | 91 | |||||||||||||||||||||||||||||||||||||||||||||||||||||||||||||||||||||||
| Sweden | 104 | 90 | 107 | 119 | 114 | 99 | 130 | 138 | |||||||||||||||||||||||||||||||||||||||||||||||||||||||||||||||||||||||
| Source: Eurostat. |
Read more about this topic in Eurostat`s " Statistics in Focus ".
Tables:
The statistics is now published as Comparison of price levels in Europe.
Contact
-
Statistics Norway's Information Centre
E-mail: informasjon@ssb.no
tel.: (+47) 21 09 46 42

