Content
Published:
This is an archived release.
Cheaper telephone services
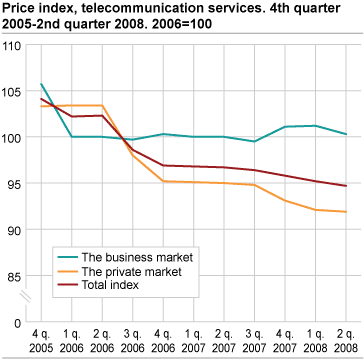
The decrease in prices of telecommunication services continues. The prices decreased by 0.6 per cent from the fourth quarter of 2007 to the first quarter of 2008. From the first to the second quarter of 2008, prices fell by 0.5 per cent.
Lower prices of mobile telephone services to private households were the main contributor to the price fall to the first quarter. From the first to the second quarter the business market also experienced lower prices of mobile telephone and internet services. In this period prices fell by 0.9 per cent in the business market.
In total, prices of telecommunication services have fallen by 2.1 per cent from the second quarter of 2007 to the second quarter of 2008. In comparison, prices fell by 5.5 per cent from the second quarter of 2006 to the second quarter of 2007.
| Period | Total index |
Changes from
same quarter in the previous year, per cent |
The private market | The business market | |||||||||||||||||||||||||||||||||||
|---|---|---|---|---|---|---|---|---|---|---|---|---|---|---|---|---|---|---|---|---|---|---|---|---|---|---|---|---|---|---|---|---|---|---|---|---|---|---|---|
| 4th quarter 2005 | 104.1 | 103.3 | 105.7 | ||||||||||||||||||||||||||||||||||||
| 1st quarter 2006 | 102.2 | 103.4 | 100.0 | ||||||||||||||||||||||||||||||||||||
| 2nd quarter 2006 | 102.3 | 103.4 | 100.0 | ||||||||||||||||||||||||||||||||||||
| 3rd quarter 2006 | 98.6 | 98.0 | 99.7 | ||||||||||||||||||||||||||||||||||||
| 4th quarter 2006 | 96.9 | -6.9 | 95.2 | 100.3 | |||||||||||||||||||||||||||||||||||
| 1st quarter 2007 | 96.8 | -5.3 | 95.1 | 100.0 | |||||||||||||||||||||||||||||||||||
| 2nd quarter 2007 | 96.7 | -5.5 | 95.0 | 100.0 | |||||||||||||||||||||||||||||||||||
| 3rd quarter 2007 | 96.4 | -2.2 | 94.8 | 99.5 | |||||||||||||||||||||||||||||||||||
| 4th quarter 2007 | 95.8 | -1.1 | 93.1 | 101.1 | |||||||||||||||||||||||||||||||||||
| 1st quarter 2008 | 95.2 | -1.7 | 92.1 | 101.2 | |||||||||||||||||||||||||||||||||||
| 2nd quarter 2008 | 94.7 | -2.1 | 91.9 | 100.3 | |||||||||||||||||||||||||||||||||||
About the industryAccording to Statistics Norway’s structural statistics, the telecommunication industry consisted of 697 enterprises with a total turnover of about NOK 60.8 billion in 2006. The industry is characterised by a few large enterprises. Prices in the statisticsThe price information is for fixed telephony, mobile telephone and Internet services. New standard industrial classificationThe statistics for the first quarter of 2009 will be published according to the new standard industrial classification (NACE rev.2). In the new standard, the industry consists of wired telecommunications, wireless telecommunications, satellite telecommunications and other telecommunications activities. For more information, see About the statistics . |
The statistics is published with Producer price indices for services.
Contact
-
Statistics Norway's Information Centre
E-mail: informasjon@ssb.no
tel.: (+47) 21 09 46 42

