Content
Published:
This is an archived release.
Price for freight transport by road declines
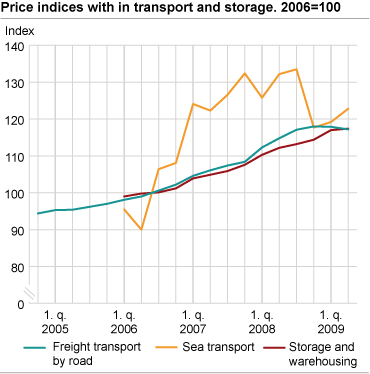
The price index for storage was nearly unchanged with only a 0.4 per cent rise, while a decline of 0.7 per cent was registered for freight transport by road in the period between the 1st quarter of 2009 and the 2nd quarter of 2009. The price index for sea transport increased by 3 per cent during the same period.
Sea transport is the only one of the three indices facing a remarkable decline compared to the same quarter one year ago.
Decline in price for freight transport by road
Within freight transport by road, the prices for mixed goods/container goods declined the most; by 0.9 per cent. This was closely followed by dry goods in bulk and frozen or refrigerated goods, which declined by 0.8 and 0.6 per cent respectively. Transport prices for petroleum products, other gases and liquids, and other transportation in special vehicles were, meanwhile, barely changed with a decline between 0.1 and 0.2 per cent relative to the previous quarter. The aggregate index for freight transport by road was 117.2 for the 2n d quarter of 2009. The price index grew by 2.1 per cent since the 2n d t quarter of 2008, which is the lowest annual growth since the index inception.
Ocean transport of dry bulk continues to increase
Ocean transport with goods increased by 5.8 per cent compared to the last quarter. This is due to a price increase in ocean transport of dry bulk by 32.9 per cent. However, compared to the top rate registered in the same quarter one year ago this is down 58.4 per cent. The remaining sub indices within ocean transport all decreased compared to the 1s t quarter of 2009, whereas the most remarkable one was within ocean transport of crude oil and oil products, which is down by 25.3 per cent.
The total index for sea transport is down 7.1 per cent compared to the same quarter one year ago.
Stability in storage prices
The price index for storage services remains fairly unchanged, with a nominal growth amounting to 0.4 per cent in the period 1s t quarter 2009 to 2n d quarter 2009. The index grew by 17.4 per cent since 2006 and grew by 4.6 relative to the same quarter in the preceding year.
| Industry | Price index 2nd quarter 2009 | Perscentage change | |||||||||||||||||||||||||||||||||||||
|---|---|---|---|---|---|---|---|---|---|---|---|---|---|---|---|---|---|---|---|---|---|---|---|---|---|---|---|---|---|---|---|---|---|---|---|---|---|---|---|
| 1st quarter 2009-2nd quarter 2009 | 2nd quarter 2008-2nd quarter 2009 | ||||||||||||||||||||||||||||||||||||||
| Freight transport by road | 117.2 | -0.7 | 2.1 | ||||||||||||||||||||||||||||||||||||
| Sea transport | 122.8 | 3.0 | -7.1 | ||||||||||||||||||||||||||||||||||||
| Storage and warehousing | 117.4 | 0.4 | 4.6 | ||||||||||||||||||||||||||||||||||||
New publishing routinesPrice indices belonging to the main industrial classification Transport and Storage will be jointly published starting the first quarter of 2009. The indices included are freight transport by road, sea transport, and storage and warehousing. The indices use 2006 as a base year (2006=100). |
The statistics is published with Producer price indices for services.
Contact
-
Statistics Norway's Information Centre
E-mail: informasjon@ssb.no
tel.: (+47) 21 09 46 42

