Content
Published:
This is an archived release.
Price increase in sea transport
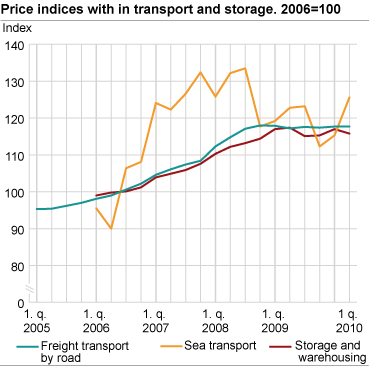
The price index for sea transport increased by 2.3 per cent between the second quarter of 2009 and the second quarter of 2010 and rose 8.9 per cent compared to the previous quarter. The index for freight transport by road remained unchanged in the same time span.
The price index for storage and warehousing measures 115.8 in the second quarter of 2010; a decline of 0.8 per cent compared to the last quarter.
Steady road freight prices
Within freight transport by road, the prices were unchanged compared to the previous quarter. The steadiness is evenly distributed along the sub indices from a 0.0 to 0.4 per cent increase. The exceptions are prices of dry bulk transport, which fell 2 per cent compared to the previous quarter.
Relative to the same quarter last year, the total index of freight transport by road rose by 0.5 per cent. The sub indices with the largest decline in the same time span were dry bulk transport and the transportation of frozen or refrigerated goods, which fell by 0.8 and 0.5 per cent respectively. However freight prices of petroleum products rose by 2.9 per cent in the same period.
Increase in prices within freight ocean transport
The index for ocean transport with goods rose by 8.0 per cent compared to the last quarter. The increase is mainly due to higher prices within ocean transport of dry bulk. However, prices also increased for ocean transport of chemicals and gases together with crude oil and oil products.
The prices within freight coastal transport fell by 4.1 per cent compared to the previous quarter and measure the same level as the second quarter of 2009.
Fall in storage prices
The index of storage prices fell by 0.8 per cent due to a remarkable decrease in frozen/cool storage, which fell by 3.2 per cent compared to the first quarter of 2010.
The index fell 1.3 per cent in relation to the same quarter last year.
| Industry | Price index 2nd quarter 2010 | Percentage change | |||||||||||||||||||||||||||||||||||||||||||||||||||||||||||||||||||||||||||||
|---|---|---|---|---|---|---|---|---|---|---|---|---|---|---|---|---|---|---|---|---|---|---|---|---|---|---|---|---|---|---|---|---|---|---|---|---|---|---|---|---|---|---|---|---|---|---|---|---|---|---|---|---|---|---|---|---|---|---|---|---|---|---|---|---|---|---|---|---|---|---|---|---|---|---|---|---|---|---|---|
| 1st quarter 2010-2nd quarter 2010 | 2nd quarter 2009-2nd quarter 2010 | ||||||||||||||||||||||||||||||||||||||||||||||||||||||||||||||||||||||||||||||
| Freight transport by road | 117.7 | 0.0 | 0.5 | ||||||||||||||||||||||||||||||||||||||||||||||||||||||||||||||||||||||||||||
| Sea transport | 125.6 | 8.9 | 2.3 | ||||||||||||||||||||||||||||||||||||||||||||||||||||||||||||||||||||||||||||
| Storage and warehousing | 115.8 | -0.8 | -1.3 | ||||||||||||||||||||||||||||||||||||||||||||||||||||||||||||||||||||||||||||
The statistics is published with Producer price indices for services.
Contact
-
Statistics Norway's Information Centre
E-mail: informasjon@ssb.no
tel.: (+47) 21 09 46 42

