Content
Published:
This is an archived release.
Sharp price fall in air transport
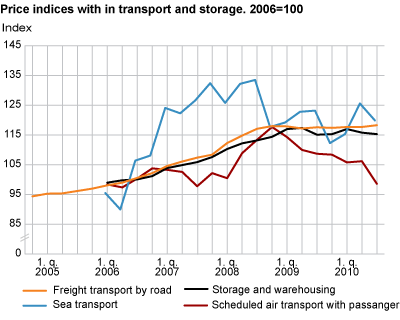
Prices reported by Norwegian airlines in the 3rd quarter of 2010 are at their second lowest level since the start of the index series in 2006. Only in the 3rd quarter of 2007 were prices lower.
The overall price index is at 98.6 in the 3rd quarter of 2010. With a reference year in 2006, prices in the 3rd quarter of 2010 are thus 1.4 per cent lower than what they were 4 years ago.
Fuel costs and competition in air transport
The overall index for passenger air transport attained its highest level in the 4th quarter of 2008 with a value of 117.7. This was caused by very high fuel prices, which in turn was reflected in higher transport prices. Prices started a steep upward trend in the 2nd quarter of 2008; an 8.3 per cent increase from the previous quarter. Following the peak in the 4th quarter of 2008, prices fell, more or less continuously, until the 3rd quarter of 2010. The effect of fuel costs cannot alone explain the decline for the last 7 quarters. Frequent statements in the media suggest that sharpened competition and rigidities in the demand side could be pushing prices further down.
Business travellers pay more
In the third quarter of 2010 the sub index for business travellers was at 103.1, while the sub index for leisure travellers was at 91.2. Compared to 2006, the price for business travellers is 3.1 per cent higher, while the price for leisure travellers is 8.8 per cent lower. Although business travellers pay more for their tickets than leisure travellers, there are no systematic differences in the price development. Prices tend to move in unison. However, this seems to have changed for the last year. Prices faced by business travellers are, in the 3rd quarter of 2010, 6.5 per cent lower than in the 3rd quarter of 2009, while prices for leisure travellers fell by 11.5 per cent in the same period.
Decline in freight ocean transport
The total index for sea transport has a value of 119.9 in the third quarter of 2010, down by 4.5 per cent to the previous quarter and 2.7 per cent to the same quarter last year. This is due to a decline in the sub index for freight ocean transport, down 8 per cent from the previous quarter. The decline is heavily influenced by a strong fall in the price for dry bulk transport.
Stability in storage and freight transport by road
The price indices for storage as well as freight transport by road remain relatively stable. The index for freight transport by road rose by 0.5 per cent between the 2nd and 3rd quarter of 2010, while storage prices fell by 0.5 per cent in the same period. With respect to the same quarter last year, storage prices remain almost unaltered. Freight transport by road, on the other hand, rose by 0.6.
| Industry | Price index 3rd quarter 2010 | Percentage change | |||||||||||||||||||||||||||||||||||||||||||||||||||||||||||||||||||||||||||||
|---|---|---|---|---|---|---|---|---|---|---|---|---|---|---|---|---|---|---|---|---|---|---|---|---|---|---|---|---|---|---|---|---|---|---|---|---|---|---|---|---|---|---|---|---|---|---|---|---|---|---|---|---|---|---|---|---|---|---|---|---|---|---|---|---|---|---|---|---|---|---|---|---|---|---|---|---|---|---|---|
| 2nd quarter 2010-3rd quarter 2010 | 2nd quarter 2009-3rd quarter 2010 | ||||||||||||||||||||||||||||||||||||||||||||||||||||||||||||||||||||||||||||||
| Freight transport by road | 118.3 | 0.5 | 0.6 | ||||||||||||||||||||||||||||||||||||||||||||||||||||||||||||||||||||||||||||
| Sea transport | 119.9 | -4.5 | -2.7 | ||||||||||||||||||||||||||||||||||||||||||||||||||||||||||||||||||||||||||||
| Storage and warehousing | 115.3 | -0.5 | 0.1 | ||||||||||||||||||||||||||||||||||||||||||||||||||||||||||||||||||||||||||||
| Scheduled air transport with passanger | 98.6 | -7.2 | -9.3 | ||||||||||||||||||||||||||||||||||||||||||||||||||||||||||||||||||||||||||||
Service producer price index for passenger air transportThe service produce price index for passenger air transport was published for the first time in November 2010 with quarterly rates back to 2006. The index is published quarterly and consists of an overall index for passenger air transport (“Business to All”: B2A), a sub index for business travel (“Business to Business”: B2B) and a sub index for leisure travel (“Business to Consumer”: B2C). Data is collected from the three largest airline companies, and is based on a selected sample of domestic and international city pairs. |
The statistics is published with Producer price indices for services.
Contact
-
Statistics Norway's Information Centre
E-mail: informasjon@ssb.no
tel.: (+47) 21 09 46 42

