Content
Published:
This is an archived release.
Record low prices for ocean transport
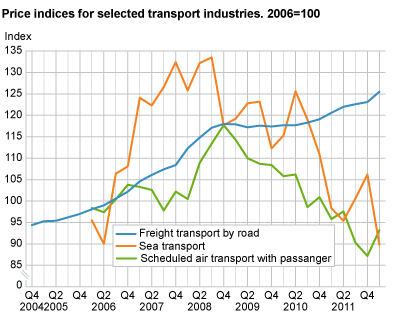
The price index for ocean transport reached its lowest ever level in the first quarter of 2012. The price indices for passenger air transport and freight transport by road increased during the 1st quarter of 2012 compared to the same quarter last year. Postal and courier services remained relatively stable during the period.
The total index for ocean transport was 89.8 in the 1st quarter of 2012. This was 8.7 per cent lower than the same period in 2011 and 15.5 per cent lower than the 4th quarter of 2011. The decrease is due to lower prices in the ocean transport of goods, especially dry bulk ocean freight, where the decrease was as much as 40.0 per cent compared with the 4th quarter of 2011and 33.7 compared to the same period in 2011.
Prices in ocean transport have been influenced by the Norwegian NOK appreciation against the dollar from the 1st quarter of 2011 to the 1st quarter of 2012. Most contracts in the maritime industry use US dollars as a medium. This means that although the price is the same, the price measured in Norwegian kroner will be lower due to the strengthening of the Norwegian krone.
Upward trend for freight transport by road
The total index for freight transport by road went up 4.1 per cent during the 1st quarter of 2012 compared to the same quarter last year. The index increased by 2 per cent compared to the preceding quarter. The price increase can mainly be attributed to the higher transport prices for mixed goods/container goods .
Flight tickets up again
The total index for passenger air transport was 93.2 in the 1st quarter of 2012. This was 2.7 per cent lower compared to the same quarter of 2011. Business trips fell 5.6 per cent. Leisure trips , on the other hand, showed almost no change.
Compared to the 4th quarter of 2011, the price for business trips increased by 8.8 per cent, leisure trips by 5.7 per cent and the total index by 6.9 per cent.
Marginal change for postal and courier services
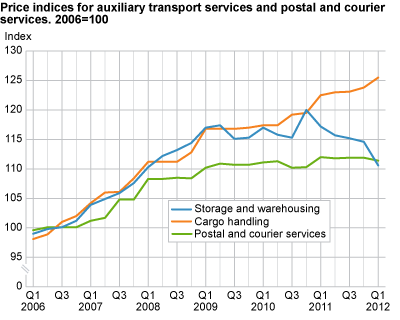
The index for postal and courier services declined by 0.5 per cent during the 1st quarter of 2012 compared to the same quarter last year. The decline can be ascribed to the decline in prices for postal activities under universal service obligation by 1.6 per cent. The total index was 0.5 per cent lower compared to the 4th quarter of 2011.
Storage and warehousing declines while cargo handling increases
The total index for storage and warehousing declined by 5.6 per cent during the 1st quarter of 2012 compared to the 1st quarter of 2011. The index for cargo handling was 2.5 per cent higher during the same period.
| Industry | Price index 1st quarter 2012 | Percentage change | |||||||||||||||||||||||||||||||||||||||||||||||||||||||||||||||||||||||||||||
|---|---|---|---|---|---|---|---|---|---|---|---|---|---|---|---|---|---|---|---|---|---|---|---|---|---|---|---|---|---|---|---|---|---|---|---|---|---|---|---|---|---|---|---|---|---|---|---|---|---|---|---|---|---|---|---|---|---|---|---|---|---|---|---|---|---|---|---|---|---|---|---|---|---|---|---|---|---|---|---|
| 4th. quarter 2011-1st quarter 2012 | 1st quarter 2011-1st quarter 2012 | ||||||||||||||||||||||||||||||||||||||||||||||||||||||||||||||||||||||||||||||
| Freight transport by road | 125.5 | 2.0 | 4.1 | ||||||||||||||||||||||||||||||||||||||||||||||||||||||||||||||||||||||||||||
| Sea transport | 89.8 | -15.5 | -8.7 | ||||||||||||||||||||||||||||||||||||||||||||||||||||||||||||||||||||||||||||
| Scheduled air transport with passanger | 93.2 | 6.9 | -2.7 | ||||||||||||||||||||||||||||||||||||||||||||||||||||||||||||||||||||||||||||
| Storage and warehousing | 110.6 | -3.5 | -5.6 | ||||||||||||||||||||||||||||||||||||||||||||||||||||||||||||||||||||||||||||
| Cargo handling | 125.5 | 1.4 | 2.5 | ||||||||||||||||||||||||||||||||||||||||||||||||||||||||||||||||||||||||||||
| Postal and courier services | 111.4 | -0.5 | -0.5 | ||||||||||||||||||||||||||||||||||||||||||||||||||||||||||||||||||||||||||||
Change in base yearThe indices are presented in StatBank in two types of tables: one comprising all indices on services (Table-09517) and the other with individual tables portraying a single industry. Starting from the 1st quarter of 2012, Table-09517 will be available with 2010 as a base year, i.e. 2010=100, while the tables per industry will be available with 2006= as a base. |
The statistics is published with Producer price indices for services.
Contact
-
Statistics Norway's Information Centre
E-mail: informasjon@ssb.no
tel.: (+47) 21 09 46 42


