Content
Published:
This is an archived release.
Sharp fall for aircraft and ships
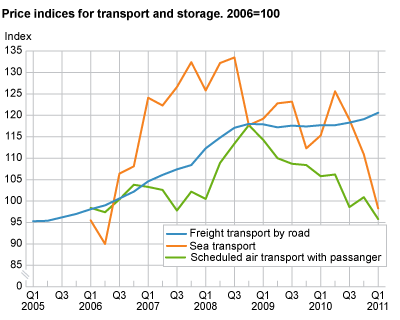
During the 1st quarter of 2011, prices for air and ocean transport were at their lowest level since 2006. Prices in storage decreased, while other sectors showed a moderate increase.
The total index for ocean transport was at 98.3 in the 1st quarter of 2011, which is 11.4 per cent lower than in the previous quarter and 14.7 per cent lower than the same quarter of 2010. The decrease is due to lower prices in the ocean transport of goods, especially dry bulk ocean freight, where the decline was 47.1 per cent compared with the same quarter in 2010. Prices in the international carriage of oil also went down, by 12.2 per cent during the same period.
Prices in the ocean transport are influenced by the Norwegian NOK appreciation against the dollar from 4th quarter of 2010 to the 1st quarter of 2011. Most contracts in the maritime industry are in dollars. This means that when the krone strengthens, the price measured in Norwegian kroner will be lower, even although the contract value remains the same.
Falling prices for air transport
The total index for air transport in the 1st quarter of 2011 was 95.8 compared to 100.9 in the 4th quarter of 2010 and 105.8 in the 1st quarter of 2010. This represents a decrease of 9.5 per cent from last year and 5.1 per cent compared with the previous quarter.
Business trips and leisure travel followed the same trend as the overall index. These fell by 4.7 and 5.5 per cent compared with the previous quarter, and 11.3 and 8.9 per cent compared with the same quarter in 2010.
Continued growth in freight transport by road
Prices in freight transport by road had an increase of 1.3 per cent from the 4th quarter of 2010 to the 1st quarter of 2011, and 2.4 per cent compared with the same quarter in 2010.
Slight increase for postal and courier activities
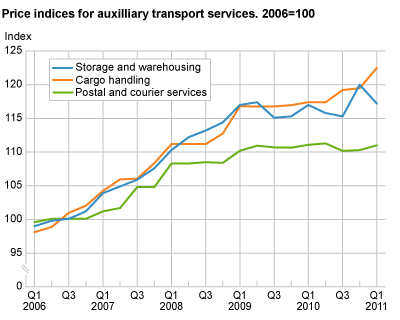
The index for postal and courier activities increased by 0.6 per cent compared to the 4th quarter of 2010, but decreased 0.1 per cent compared to the 1st quarter of 2010. The index includes the two sub-indices postal activities under universal service obligation and other postal and courier services. The sub-indices had an increase of 1.8 and 0.4 per cent respectively compared to the 1st quarter of 2010.
| Industry | Price index 1st quarter 2011 | Percentage change | |||||||||||||||||||||||||||||||||||||||||||||||||||||||||||||||||||||||||||||
|---|---|---|---|---|---|---|---|---|---|---|---|---|---|---|---|---|---|---|---|---|---|---|---|---|---|---|---|---|---|---|---|---|---|---|---|---|---|---|---|---|---|---|---|---|---|---|---|---|---|---|---|---|---|---|---|---|---|---|---|---|---|---|---|---|---|---|---|---|---|---|---|---|---|---|---|---|---|---|---|
| 4th quarter 2010-1st quarter 2011 | 1st quarter 2010-4th quarter 2011 | ||||||||||||||||||||||||||||||||||||||||||||||||||||||||||||||||||||||||||||||
| Freight transport by road | 120.6 | 1.3 | 2.4 | ||||||||||||||||||||||||||||||||||||||||||||||||||||||||||||||||||||||||||||
| Sea transport | 98.3 | -11.4 | -14.8 | ||||||||||||||||||||||||||||||||||||||||||||||||||||||||||||||||||||||||||||
| Scheduled air transport with passanger | 95.8 | -5.1 | -9.5 | ||||||||||||||||||||||||||||||||||||||||||||||||||||||||||||||||||||||||||||
| Storage and warehousing | 117.2 | -2.4 | 0.4 | ||||||||||||||||||||||||||||||||||||||||||||||||||||||||||||||||||||||||||||
| Cargo handling | 122.5 | 2.5 | 4.3 | ||||||||||||||||||||||||||||||||||||||||||||||||||||||||||||||||||||||||||||
| Postal and courier services | 111.0 | 0.6 | -0.1 | ||||||||||||||||||||||||||||||||||||||||||||||||||||||||||||||||||||||||||||
| Postal services under universal service obligation | 110.0 | 1.8 | 0.6 | ||||||||||||||||||||||||||||||||||||||||||||||||||||||||||||||||||||||||||||
| Other postal and courier services | 120.2 | 0.4 | 1.7 | ||||||||||||||||||||||||||||||||||||||||||||||||||||||||||||||||||||||||||||
Two new price indices for servicesThe service produce price index for postal and courier services as well as cargo handling is published for the first time in February 2011with quarterly rates back to 2006. The quarterly index for postal and courier services consists of a total index for the industry as well as two sub-indices on postal services under universal service obligation and other postal and courier services. Cargo handling, on the other hand, is only published as a total index. All the price indices are of a B2B type, which means that they measure the price development for services rendered to the business sector. |
The statistics is published with Producer price indices for services.
Contact
-
Statistics Norway's Information Centre
E-mail: informasjon@ssb.no
tel.: (+47) 21 09 46 42


