Content
Published:
This is an archived release.
Record low prices for passenger air transport
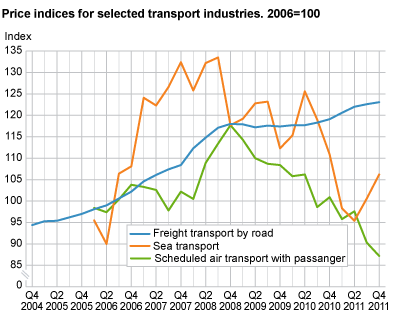
The price index for passenger air transport reached a new low during last year's final quarter. Price indices relating to road transport remained relatively stable, while the index for ocean transport rose by 5.6 per cent from the 3rd to 4th quarter of 2011.
The total index for passenger air transport fell by 3.4 per cent compared to the 3rd quarter of 2011, and by 13.6 per cent compared to the 4th quarter of 2010. Business trips contributed the most to the decline with a price fall of 17.3 per cent compared to the same period in 2010. Leisure trips declined by 10.3 per cent compared to the same period.
Slight increase for ocean transport
The total index for ocean transport was 106.2 in the 4th quarter of 2011. This was 5.6 per cent higher than the 3rd quarter of 2011 and 4.2 per cent lower than the same period in 2010. The increase is due to slightly higher prices in the ocean transport of goods, especially dry bulk ocean freight where the increase was 18.5 per cent compared with the 3rd quarter of 2011. Prices in the international carriage of oil also went up, by 5.6 per cent during the same period.
Prices in the ocean transport have been influenced by the Norwegian NOK appreciation against the dollar from the 4th quarter of 2010 to the 4th quarter of 2011. Most contracts in the maritime industry use US dollars as a medium. This means that although the price is the same, the price measured in Norwegian kroner will be lower due to the strengthening of the krone.
Stable prices for freight transport by road
Prices for freight transport by road were more or less unchanged in the 4th quarter of 2011, with a 0.4 per cent increase compared to the previous quarter. The sub-index for mixed goods/container goods went up the most at 0.6 per cent, while the sub-index for petroleum transport and other gases and liquids in bulk fell by 0.8 per cent. The total index for freight transport by road was 3.4 per cent higher than the 4th quarter of 2010.
Slight decrease in storage and warehousing
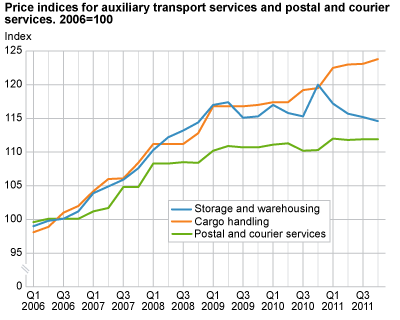
The price index for storage and warehousing was 0.5 per cent lower during the 4th quarter of 2011 with respect to the previous quarter. This was mainly due to a decline in prices for dry storage, which decreased by 1.9 per cent. Likewise, compared to the same quarter in 2010, storage prices declined by 4.5 per cent. The decline can be ascribed to a sizable fall in prices for frozen and cool storage during the last year.
Marginal increase for cargo handling
The index for cargo handling increased 0.5 per cent from the 3rd to 4th quarter of 2011. Compared to the same quarter last year, prices were 3.6 per cent higher during the 4th quarter of 2011.
The price index for postal and courier services, on the other hand, remained unchanged relative to the previous quarter. In relation to the same quarter in 2010, the index increased by 1.5 per cent. The index comprises of two sub-indices, namely: postal activities under universal service obligation and other postal and courier services . Both sub-indices remain unaltered with respect to the 3rd quarter of 2011 but increased by 1.6 and 0.9 per cent respectively relative to the 4th quarter in 2010.
| Industry | Price index 4th quarter 2011 | Percentage change | |||||||||||||||||||||||||||||||||||||||||||||||||||||||||||||||||||||||||||||
|---|---|---|---|---|---|---|---|---|---|---|---|---|---|---|---|---|---|---|---|---|---|---|---|---|---|---|---|---|---|---|---|---|---|---|---|---|---|---|---|---|---|---|---|---|---|---|---|---|---|---|---|---|---|---|---|---|---|---|---|---|---|---|---|---|---|---|---|---|---|---|---|---|---|---|---|---|---|---|---|
| 3rd. quarter 2011-4th quarter 2011 | 4th quarter 2010-4th quarter 2011 | ||||||||||||||||||||||||||||||||||||||||||||||||||||||||||||||||||||||||||||||
| Freight transport by road | 123.1 | 0.4 | 3.4 | ||||||||||||||||||||||||||||||||||||||||||||||||||||||||||||||||||||||||||||
| Sea transport | 106.2 | 5.6 | -4.2 | ||||||||||||||||||||||||||||||||||||||||||||||||||||||||||||||||||||||||||||
| Scheduled air transport with passanger | 87.2 | -3.4 | -13.6 | ||||||||||||||||||||||||||||||||||||||||||||||||||||||||||||||||||||||||||||
| Storage and warehousing | 114.6 | -0.5 | -4.5 | ||||||||||||||||||||||||||||||||||||||||||||||||||||||||||||||||||||||||||||
| Cargo handling | 123.8 | 0.5 | 3.6 | ||||||||||||||||||||||||||||||||||||||||||||||||||||||||||||||||||||||||||||
| Postal and courier services | 111.9 | 0.1 | 1.5 | ||||||||||||||||||||||||||||||||||||||||||||||||||||||||||||||||||||||||||||
Maritime transport indexThe index for ocean transport was missing on the preceding publication. The results are now available in StatBank for all previous periods. |
The statistics is published with Producer price indices for services.
Contact
-
Statistics Norway's Information Centre
E-mail: informasjon@ssb.no
tel.: (+47) 21 09 46 42


