Content
Published:
This is an archived release.
Price hike for passenger air transport
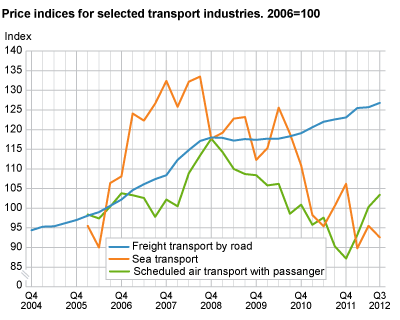
The total index for passenger air transport has increased by 14.5 per cent since the third quarter of 2011.
Passenger air transport saw a price jump of 3.1 per cent relative to the second quarter of this year and an increase of 14.5 per cent compared to the same quarter of last year. The index is now at the same level as it was in the fourth quarter of 2006.
While ticket prices for both leisure travel and business travel have increased in the course of the last year, prices for leisure travel have increased the most, by 17.7 per cent, since the third quarter of 2011. Ticket prices for business travel increased by 7.2 per cent during the period.
Continued increase in freight transport prices
Prices for freight transport by road have gone up 3.5 per cent since the third quarter of 201l. The sub-index for mixed goods/container goods increased the most, by 5 per cent, while petroleum products declined by 1 per cent during the period. The total index for freight transport was 0.9 per cent higher relative to the preceding quarter in 2012.
Lower prices for water transport
The index for water transport was at 92.6 during the third quarter of 2012. This is 8.0 per cent lower than the same quarter of the preceding year, and 3.1 per cent lower than the second quarter of 2012.
A decline in both the sub-indices for freight coastal transport and freight ocean transport, which amounted to 14.4 and 10.4 per cent respectively, has led to a decline in the total index over the last year.
Price movements in ocean transport must be seen in conjunction with exchange rate movements of the Norwegian kroner vis-à-vis the US dollar and Euro.
Declining prices for storage and warehousing
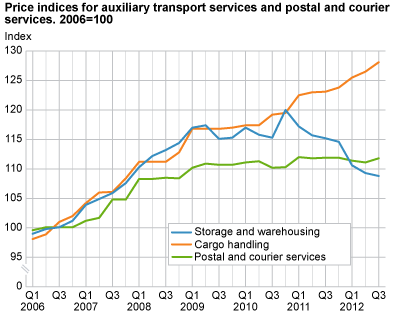
The index for storage and warehousing was at 108.6 during the third quarter of 2012; a decline of 5.6 per cent relative to the same quarter in 2011. The index was 0.5 per cent lower in relation to the second quarter of 2012.
Higher prices for cargo handling, marginal decline for postal and courier services
The total index for cargo handling was up 4 per cent during the third quarter of 2012 relative to the same quarter of 2011. Compared to the previous quarter in 2012, the index was 1.2 per cent higher.
The index for postal and courier services declined by 0.1 per cent in relation to the third quarter of 2011, while increasing 0.6 per cent relative to the second quarter of 2012.
| Industry | Price index 3rd quarter 2012 | Percentage change | |||||||||||||||||||||||||||||||||||||||||||||||||||||||||||||||||||||||||||||
|---|---|---|---|---|---|---|---|---|---|---|---|---|---|---|---|---|---|---|---|---|---|---|---|---|---|---|---|---|---|---|---|---|---|---|---|---|---|---|---|---|---|---|---|---|---|---|---|---|---|---|---|---|---|---|---|---|---|---|---|---|---|---|---|---|---|---|---|---|---|---|---|---|---|---|---|---|---|---|---|
| 2nd. quarter 2012-3rd quarter 2012 | 3rd quarter 2011-3rd quarter 2012 | ||||||||||||||||||||||||||||||||||||||||||||||||||||||||||||||||||||||||||||||
| Freight transport by road | 126.8 | 0.9 | 3.5 | ||||||||||||||||||||||||||||||||||||||||||||||||||||||||||||||||||||||||||||
| Sea transport | 92.6 | -3.1 | -8.0 | ||||||||||||||||||||||||||||||||||||||||||||||||||||||||||||||||||||||||||||
| Scheduled air transport with passanger | 103.4 | 3.1 | 14.5 | ||||||||||||||||||||||||||||||||||||||||||||||||||||||||||||||||||||||||||||
| Storage and warehousing | 108.8 | -0.5 | -5.6 | ||||||||||||||||||||||||||||||||||||||||||||||||||||||||||||||||||||||||||||
| Cargo handling | 128.1 | 1.2 | 4.0 | ||||||||||||||||||||||||||||||||||||||||||||||||||||||||||||||||||||||||||||
| Postal and courier services | 111.8 | 0.6 | -0.1 | ||||||||||||||||||||||||||||||||||||||||||||||||||||||||||||||||||||||||||||
Change in base yearThe indices are presented in StatBank in two types of tables: 1) comprising all indices on services (Table-09517) and 2) individual tables portraying a single industry. Starting from the 1st quarter of 2012, Table-09517 will be available with 2010 as a base year, i.e. 2010=100, while the tables per industry will be available with 2006=100 as a base. |
The statistics is published with Producer price indices for services.
Contact
-
Statistics Norway's Information Centre
E-mail: informasjon@ssb.no
tel.: (+47) 21 09 46 42


