Content
Published:
This is an archived release.
Prices down last six months
Manufacturing prices continued their decrease in the second half of 2001. From November to December the decline was 0.9 per cent. Prices within electricity, gas and steam supply went up 8.3 per cent reducing the decline in the total index to 0.3 per cent.
The decline in prices within manufacturing and oil and gas extraction was counteracted by the largest increase in electricity since February. The decline in prices of refined oil products and prices of food were the major reasons for the decline in manufacturing. These groups went down 5.7 per cent and 0.9 per cent respectively.
Unchanged 12-month rate for manufacturing, mining and quarrying
The 12-monht rate (December 2000 - December 2001) for manufacturing, mining and quarrying was, as last month, -4.7 per cent. After being 3.8 per cent in April this group has shown a decline every month up till now. The reason for the stagnation is moderate alterations in the 12-month rate for refined petroleum products and basic metals for the two last months. These groups have been major contributors to earlier changes within manufacturing.
Manufacturing prices in 2001
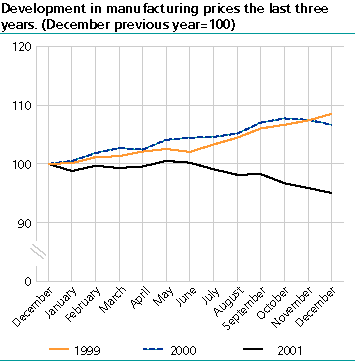
Manufacturing prices have shown a negative trend in the second half of 2001. From December to December prices have gone down 5 per cent. The same figures for 2000 and 1999 were up 6.7 per cent and up 8.5 per cent. This development can also be seen for refined petroleum products and basic metals, which went down 29 per cent and 15.8 per cent from December 2000 to December 2001. Both grouping showed strong increases in 1999 and 2000.
| Commodity price index for the industrial sectors. 2000=100 |
| December 2001 | Changes, per cent | ||||||||||||||||||||||||||||||||||||||
|---|---|---|---|---|---|---|---|---|---|---|---|---|---|---|---|---|---|---|---|---|---|---|---|---|---|---|---|---|---|---|---|---|---|---|---|---|---|---|---|
| November 2001-December 2001 | December 2000-December 2001 | ||||||||||||||||||||||||||||||||||||||
| Total index | 84,08 | -0,3 | -14,1 | ||||||||||||||||||||||||||||||||||||
| Oil and gas extraction | 72,34 | -0,4 | -22,5 | ||||||||||||||||||||||||||||||||||||
| Manufacturing, mining and quarrying | 97,15 | -0,9 | -4,7 | ||||||||||||||||||||||||||||||||||||
| Electricity, gas and steam supply | 153,70 | 8,3 | 21,4 | ||||||||||||||||||||||||||||||||||||
Additional information
Contact
-
Statistics Norway's Information Centre
E-mail: informasjon@ssb.no
tel.: (+47) 21 09 46 42

