Elderly recipients of social assistance and WAA unlikely to return to work
Published:
Young long-term recipients of social assistance have a closer attachment to the labour market than older recipients. They also receive WAA for longer.
- Full set of figures
- Welfare benefits – labour and reception of benefits
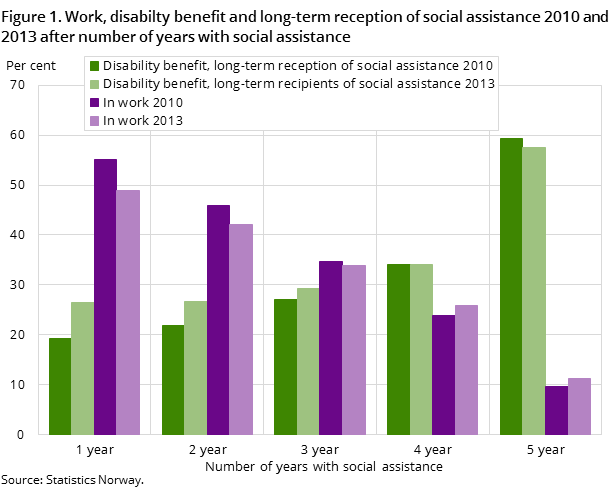
Social assistance is in principle a temporary benefit, and it is an objective that most of the recipients get access to the labour market and do not receive this benefit for a long period of time. There is no doubt that the social assistance recipients are struggling in the labour market. Of those receiving social assistance in 2009, only 51.8 per cent had some employment in the period 2009-2013. Only 22.9 per cent had some employment in at least four out of the five years. For recipients of social assistance in 2006, the share in work at least in four of the five years was slightly higher, at 27 per cent.
Typical recipients of social assistance in 2009 have had both new admissions as well as exits in the social assistance scheme the following five-year period. In total, 78.1 per cent received social assistance also after the year 2009, and 26.5 per cent received social assistance through all the years in the period 2009-2013. Which groups are most dependent on social assistance during such a five-year period? The general picture is that men in the age group 35-44 years and persons with only a primary and lower secondary education, as well as immigrants from Asia, Africa were most dependent on social assistance. Among recipients with an education of more than primary and lower secondary school, few are receiving social assistance. Recipients of social assistance with a higher education were also less dependent on social assistance over time. 69.8 per cent of the recipients with social assistance in 2009 who had an education from university or college, also received social assistance after 2009, while 21,9 per cent received social assistance for the full five-year period. For recipients of social assistance with only a primary and lower secondary education, the corresponding figures were 81.3 and 28.9 per cent.
If we study the group receiving social assistance in all of the years from 2009 until 2013, 65.4 per cent were not in work in the period, and very few worked all years. Even among those only receiving social assistance in 2009, 35.3 per cent were not in work any of the years. However, the positive aspect is that 41.9 per cent were working four or five years in the period 2009-2013.
Many recipients of social assistance attempt to enter the labour market
Even if many social recipients are not in work, there are several who are applying for work on their own or attempting to get work through WAA.
There are also a few recipients of social assistance who take education. If we study recipients of social assistance in 2009, the share of 100% unemployed was 25,6 per cent on average for the years 2010-2013, and on average 28,7 percent of them received WAA in the five-year period.
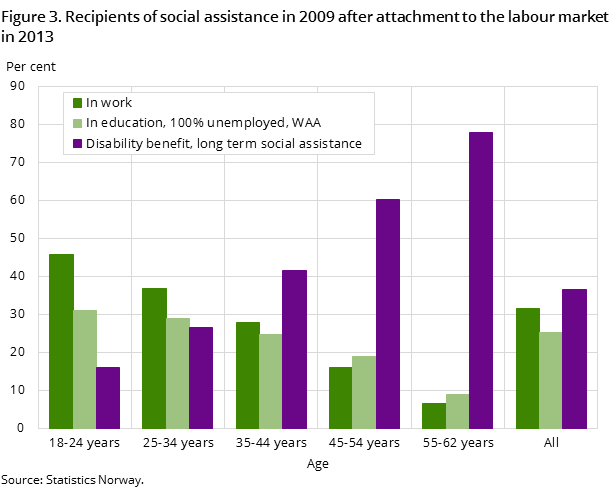
To give a better description of the situation regarding recipients of social assistance in the labour market and an indication of the possibility for success in the labour market, we will study the participation in the labour market at the end of the five-year period. Of all the social assistance recipients in 2009, 36.4 per cent received either a disability benefit or were recipients of social assistance for longer periods in 2013, 31.4 per cent were working, while 25.3 per cent were either in education, unemployed or receiving WAA. Evaluated in this way it seems easier for the youngest recipients of social assistance to enter work. For the age group 25-34 years it already becomes more difficult, and the majority of the age group 45-54 years was outside the labour market.
One of five long-term recipients of sickness benefit were unemployed in 2009-2013
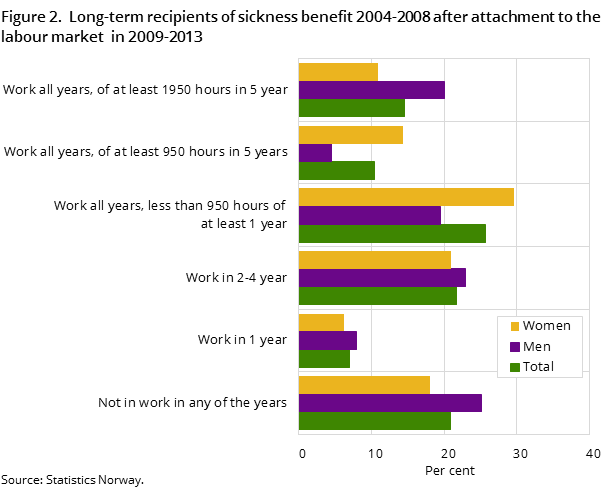
Sickness benefit is a benefit that requires attachment to the labour market, and it is a general aim that the majority will enter the labour market after the end of the absence period. In total, 20.8 per cent of all long-term recipients in the period 2004-2008 were unemployed in 2009-2013 (figure 2). Men who are long-term recipients are more often unemployed than women; 25.1 and 18.0 per cent respectively. The share who were unemployed also increases with age.
More education improves the possibility that long-term recipients are working during the five-year period after a period of sickness absence. The share who were unemployed in 2009-2013 varies from 28.5 per cent for those with a primary and lower secondary education as highest completed education, up to 12.3 per cent for those with an education from the university. In total, 30.8 per cent of long-term recipients from Asia, Africa etc. were unemployed in the period 2009-2013. They are therefore somewhat more often unemployed than long-term recipients from the EU/EEA etc., where the share was 21.2 per cent.
Every seventh long-term recipient in a permanent full-time job
From nearly 390 000 persons with long-term sick absence in 2004-2008, 14.5 per cent were in what we are calling a permanent full-time job in 2009-2013. This corresponds to 1950 hours or more in all five years. Even if men more frequently than women were unemployed among long-term recipients, it was more common that men were in a permanent full-time job; 20.1 per cent compared to 10.9 per cent women. Long-term recipients in the age group 35-54 years had the highest probability for being in a permanent full-time job. The probability of having a permanent full-time job also increases with increasing education. Only 8.7 per cent of the immigrants from Asia, Africa etc., who were long-term recipients of sickness benefit, were in a permanent full-time job in 2009-2013. This is somewhat lower than for immigrants from EU/EEA etc. and persons without an immigrant background, where the shares are 13.8 and 14.9 per cent respectively.
Many women who were long-term recipients of sickness benefit were partly in work
Between the extremes ‘without labour’ and ‘permanent full-time job’, 64.7 per cent of all long-term recipients had a looser attachment to the labour market. A relatively small group, 6.9 per cent, had work only in one of the years 2009-2013. Many more, 21.1 per cent, did have work from two till four years in the period, but not in all of the years. Furthermore, there are two groups of long-term recipients of sickness benefit who had work in all the years of the outcome period, but not a permanent full-time job. In total in the period 2009-2013, this made up 36.1 per cent of the long-term recipients of sickness benefit. Among women, this applies to 44 per cent, while the corresponding share for men was 24 per cent. Here we find some of the reason for the distinction of gender in shares without work and in a permanent full-time job.
Largest transition to disability benefit for long-term recipients of sickness benefit with low education
As with the recipients of social assistance, we also can see the attachment to the labour market at the end of the five-year period as an indication of the opportunity for success on the labour market.
In total, 62.8 per cent of all the long-term recipients of sickness benefit were in work in 2013. There were many more women than men who have been long-term recipients of sickness benefit, but it is a fact that a higher share of women than men, who are long-term recipients of sickness benefit, were in work after five years, 66.4 per cent compared with 57.3 per cent. As we have seen, this is connected with the fact that relatively many women are working less than a full-time job. The chance that persons who have been long-term recipients of sickness benefit are in work five years later is clearly increasing the higher the education they have, and the tendency is more evident among women than men.
Half of the immigrants from Asia, Africa etc. who were long-term recipients of sickness benefit were in work in 2013. For those with a background from the EU/EEA etc. this concerned six among ten. In total, 25.9 per cent of the long-term recipients of sickness benefit were recipients of disability benefits in 2013, and the share is equal for women and men.
This share is naturally increasing with age. In total, 30.7 per cent of the long-term recipients of sickness benefit with a primary and lower secondary education were receiving disability benefit, much the same thing concerned 17.9 per cent of those with a university or college education.
The share of long-term recipients of sickness benefit that have become recipients of disability benefit in 2013 is lower in immigrant groups than among persons without an immigration background; 19.7 per cent among those from the EU/EEA etc., 18.8 per cent among those from Asia, Africa etc.
In 2013 19.8 per cent of the long-term recipients of sickness benefit received WAA. This concerned a larger share of women than men.
Younger receive WAA longer than the elderly
In 2010, WAA replaced the previous schemes rehabilitation money, temporary disability benefit and vocational rehabilitation allowance. Most of the recipients on these schemes were transferred to WAA when it was introduced, and these constituted a large part of those receiving WAA in 2010; eight out of ten.
The almost 197 000 persons who received WAA this year left the scheme gradually as they found employment or went to other schemes. In total, 32.0 per cent were out after 2011, but by the end of 2014 18.5 per cent still received WAA. Even among those transferred from the previous schemes (rehabilitation benefits)
there were still 16.4 per cent recipients of WAA by the end of 2014. Among new recipients of WAA, 26.6 per cent were still receiving this benefit four years later. The exit from WAA increases with age. The share of WAA recipients in 2010 who still received WAA in December 2014 is largest among the young: 32.1 and 25.7 per cent respectively among those in the age groups 18-24 years and 25-34 years. In comparison, the share was only 7.7 per cent among those aged 55-62 years. The elderly are also out of WAA earlier; 47.2 per cent of those in the age-group 55-62 years were out of the scheme after 2011, compared with 19.5 per cent among the youngest. This has probably a connection with the fact that it can be more natural for the elderly to move from WAA to disability pension than for the younger groups.
In the two youngest age groups, women stay on WAA longer than men. Among the youngest recipients in 2010 there were 36.7 per cent of the women and 27.1 per cent of the men who still received WAA in December 2014. Among the age group 25-34 years, the difference is 7.3 percentage points.
New WAA recipients enter work to a greater extent
The two most typical outcomes after WAA were work and disability benefit. Among the recipients of WAA in 2010, who were out of WAA after the years 2010, 2011 and 2012, nine out of ten were in work or on disability benefit in 2013. It is the new recipients in 2010 who to the greatest extent enter work. Among the exits in 2010, 65.3 per cent entered work in 2013, and 55.4 per cent had work for at least 950 hours. Only 18.8 per cent went on to disability benefit without being in work. This is persons who have received WAA for a short time; less than 11 months. Among those who were transferred from the old schemes (rehabilitation benefits) that WAA replaced, few entered work. Among the exits from WAA in 2010, 47.2 per cent were in work and 43.5 per cent were on disability benefit in 2013.
The exit was larger and happened faster among the elderly due to the fact that a larger part started on disability benefits. Among the age-group 55-62 years who received WAA in 2010 and left the scheme in 2010, 2011 and 2012, more than six out of ten received disability benefit in 2013 without being in work, while about three out of ten were in work. Among the young in the age group 25-34 years, approximately six out of ten were in work, and between two and three out of ten received disability pension in 2013 without being in work.
Higher education usually means that it is easier to get work, and this also applies to WAA recipients. From WAA recipients in 2010 who left the scheme during the period 2010 and who had a university or college education, 67.5 per cent were in work in 2013 and 24.4 per cent received disability benefit. A total of 55.6 per cent of those who left the scheme were in work in 2013 and 36.2 per cent were receiving disability benefit. Even if those with only a primary and lower secondary education were somewhat younger, approximately 37.8 and 36.9 per cent of them were in work and almost 51.7 and 53.5 per cent received disability benefit in 2010 and 2013 among those who exited the scheme in 2010 and 2012.
Immigrants from Asia, Africa etc. generally find it more difficult to enter work. This applies also to recipients of WAA in 2010 who stopped receiving the benefit in the same year. Among these, the share in work in 2013 was 37.3 per cent among immigrants from Asia, Africa etc. compared with 50.3 per cent among persons without an immigration background. The difference in the share receiving disability benefit is however substantially less.
Fewest men became disability pensioners in 2013
More than 23 700 persons became disabled in 2013; 41.3 per cent of these were men. The age groups 55-62 years and 45-54 years constituted the largest shares of the new disability pensioners this year. They constituted 30.6 and 28.9 per cent respectively. 81.5 per cent of the new disability pensioners only had a primary or lower secondary education or secondary education.
In 2012, the year before they were granted disability pension, 52.8 per cent in the age group 63 years and older had what we here define as the strongest position on the labour market. The general tendency for the older age group was nevertheless that the position became weaker for everyone the closer they came to the year they became disabled. Do we find the same tendency also for younger persons with disability benefits?
We see that in 2009, five years before they were granted disability benefit, the age groups 18-24 years and 25-34 years were in the weakest position in the labour market, with 88.3 and 62.9 per cent. Among those who started on disability benefit in 2013, it was the age group 18-24 years that had the weakest attachment to the labour market in the period before receiving disability benefit. The share with the weakest position in the labour market was 88.3 per cent in 2009 for this young age group, and this increased to 91.8 per cent in 2012. The attachment to the labour market was a bit better for those aged 25-34 years who started on disability pension in 2013, 62.9 per cent had the weakest position in 2009. However, in this age group the position became strongly impaired as the point in time for disability benefit approached; 83.1 per cent had the weakest position in 2012.
More women than men had a strong position in the labour market in the period; 39.7 per cent of the women were in the strongest position in 2012, the year before they started on disability benefit. The corresponding share for men the same year was 29.3 per cent. There were also more men than women who were in the weakest position; 67.1 per cent men compared with 58 per cent women in 2012, the year before they started on disability benefit.
Increase in receipt of WAA prior to disability benefit
During the period we have studied there has been a considerable increase in the share who received WAA before disability benefit. In all years from 2009 until 2012, the share receiving WAA increased (and rehabilitation benefits) among those who became disability pensioners in 2013. The increase in receipt of WAA was from 42.1 per cent in 2009 to 78.5 per cent in 2012. This means that there was a relatively large increase in the receipt of WAA prior to disability benefit. The largest increase was from 2009 to 2010, when the WAA scheme was introduced and replaced the previous rehabilitation benefits. In 2010, 61.1 per cent of those who became disability pensioners in 2013 received WAA, corresponding to an increase of 19 percentage points from the year before. Among all new recipients of disability benefit in 2013, there were only 21.5 per cent who did not receive WAA in 2012. This is most probably a reflection of the requirement to secure income through WAA while the attachment to the labour market is being clarified.
Contact
-
Unni Beate Grebstad
-
Tor Morten Normann
-
Arve Hetland
-
Statistics Norway's Information Centre


