Content
Published:
Pension expenditure doubled
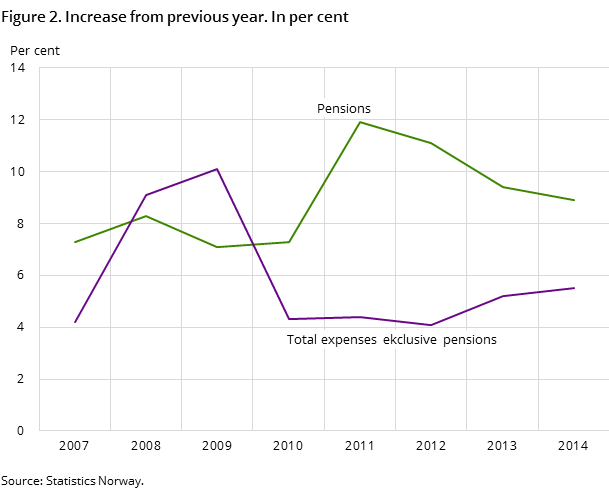
Central government payments of old age pensions increased by 98 per cent from 2006 to 2014. This increase is much higher than in most other central government expenditure.
| 2011 | 2012 | 2013 | 2014 | |
|---|---|---|---|---|
| Input, expenses | ||||
| Own production (mill. NOK) | 253 307 | 266 415 | 280 000 | 298 838 |
| Wage costs in per cent of own production (per cent) | 63.3 | 63.9 | 63.8 | 63.7 |
| Investments (mill. NOK) | 37 080 | 40 035 | 48 045 | 54 416 |
| Transfers (mill. NOK) | 673 955 | 706 742 | 743 705 | 782 772 |
| Total expenditure (mill. NOK) | 964 342 | 1 013 192 | 1 071 750 | 1 136 026 |


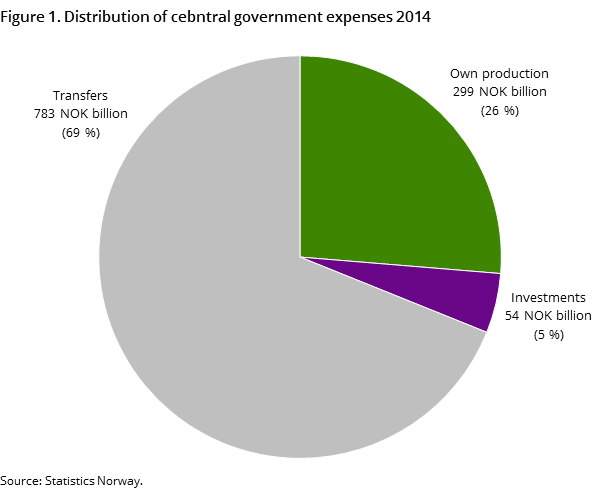
Total government expenditure has been calculated to NOK 1 136 billion in 2014. Transfers account for 69 per cent, own production accounts for 26 per cent and investments account for 5 per cent of this sum. The distribution of expenses has been largely unchanged since 2006.
NOK 420 billion paid through NAV
The central government transferred NOK 420 billion to private individuals through NAV in 2014. Old age pensions accounted for the main part of this sum with NOK 180 billion. Payments of old age pensions have almost doubled since 2006. Payments of other benefits have increased by about 40 per cent in the same period.
Transfers from the central government outside the NAV system accounted for somewhat less than half of the total transfers in 2014. Pensions to former central government employees are not paid through NAV, and were about NOK 20 billion in 2014.
The large increase in payments of old age pensions is due to an increase in the number of recipients. This increase is expected to continue as the age structure in the general population changes.
Highest expenditure in health enterprises
Out of the 250 government enterprises included in the statistics, the health enterprises have the highest expenditure measured in own production. Six of the 10 government enterprises with the highest own production are health enterprises. Health enterprises account for about one third of central government' own production. This is more than in the Armed Forces, universities and university colleges, The Norwegian Public Roads Administration and the police combined.
Own production in the health enterprises has increased by about 65 per cent from 2006 to 2014. Other central government own production has increased by 55 per cent in the same period. The highest increase has been in transport and communications; both The Norwegian National Rail Administration and The Norwegian Public Roads Administration have doubled their own production from 2006 to 2014. The lowest increase has been in defence services – about 30 per cent in 8 years.
Highest investments in roads and railroads
Transport and communications has also seen the highest increase in investments over the years 2006 to 2014. The Norwegian National Rail Administration invested almost five times as much in 2014 as in 2006. The Norwegian Public Roads Administration has also increased their investments at a high rate. The rail and road administrations now account for about half of the total central government investments. The Armed Forces, health enterprises and Statsbygg/Forsvarsbygg accounted for 18, 11 and 10 per cent of central government investments respectively in 2014.
New standard chart of accountsOpen and readClose
Since 2014, most government enterprises have used a new common chart of accounts. This may have changed the distribution of expenses reported in the basic data for these statistics.
Contact
-
Statistics Norway's Information Centre
E-mail: informasjon@ssb.no
tel.: (+47) 21 09 46 42
