Content
Published:
This is an archived release.
No increased R&D in 2009
Norwegian business enterprises reported a total of NOK 18.2 billion in research and development (R&D) expenditure in 2009. This represents no change compared to 2008. In fixed prices, this equals a reduction of 3.9 per cent.
The final figures for R&D in business enterprises have been adjusted downward compared to preliminary figures published in October 2010. This is a result of new information from significant R&D actors. The figures for 2008 are corrected down for the same reason, so the change from 2008 to 2009 is about the same as previously published.
The total number of R&D man-years in 2009 was 15 673; a 1.9 per cent decrease compared with corrected figures for 2008. Sixty-nine per cent of R&D man-years were performed by personnel with higher education. A total of 23 468 persons were involved with R&D activities in 2009.
Increased compensation of employees and decreased investments
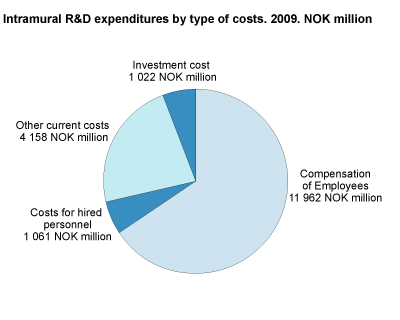
In spite of unchanged total R&D expenditures, the compensation of employees increased by 3.6 per cent from 2008 to 2009. Compensation of employees accounted for nearly NOK 12 billion. Costs for hired personnel and other current costs decreased by 1.9 per cent. Investments in buildings and machinery accounted for slightly more than NOK 1 billion. This is a decrease of more than NOK 340 billion from 2008. Investments in buildings and machinery usually vary somewhat from year to year.
Manufacturing enterprises spent NOK 7.9 billion on R&D, while the service industries spent NOK 8.5 billion on R&D. This is unchanged in nominal terms compared with 2008 for both of these sectors. The R&D expenditures were 7.6 per cent higher in the service industries compared with the manufacturing industries. When sorted by number of employees in the enterprises, there were only small changes from 2008 to 2009.
Most internal funding
The business enterprises largely finance R&D activity with internal funding. The internal funding accounted for 75.4 per cent of the enterprises’ intramural R&D expenditures in 2009. Total public spending made up 7.1 per cent. The contribution of SkatteFUNN accounted for 3 percentage points of this. The rest of the funding was mainly covered by external private funding, including enterprises in the same enterprise group. Funding from abroad made up 11 per cent.
Slight increase in purchase of R&D services
In addition to intramural R&D, the business enterprise sector purchased R&D services for NOK 5.6 billion in 2009. This is a 4.2 per cent increase compared with 2008, which is significantly weaker than the growth over the last years. The service industries contributed to the increase, while the manufacturing industries saw a decrease in the purchase of R&D services.
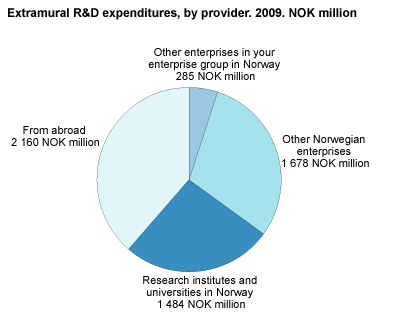
The business enterprises purchased R&D services from abroad for nearly NOK 2.2 billion in 2009, which accounts for 38.5 per cent of the total purchased R&D services. Services purchased from other Norwegian businesses accounted for approximately NOK 1.7 billion. A total of 1.5 NOK billion worth of services were purchased from Norwegian research institutes and universities.
High level of R&D in petroleum and health
The business enterprises spent nearly NOK 3.2 billion in current costs for R&D in the petroleum activity. Approximately a third of these R&D activities were performed in the industry “Extraction of petroleum and gas”, while two thirds were performed in the manufacturing and service industries.
About NOK 1.5 billion was spent in the business enterprise sector on health related R&D. The manufacturing sector contributed 60 per cent of this R&D activity, especially from the Pharmaceuticals.
With regard to other thematic fields, NOK 819 million was spent on R&D within renewable energy. Marine R&D accounted for NOK 347 million and maritime R&D accounted for NOK 560 million in current costs.
About the dataThe R&D statistics are based on information collected from the enterprises. All enterprises with 50 employees or more are included. In addition, a sample of enterprises with 10-49 employees is drawn and total figures for this group are calculated based on this sample. As a result, there is greater uncertainty surrounding the results for the small enterprises. |
Tables:
- Table 1 R & D in Business Enterprise Sector. Intramural and Extramural R & D, R & D-personnel and R & D man-years, by industry and size class. 2008 and 2009 . NOK million and number
- Table 2 R & D in Business Enterprise Sector. Intramural and extramural R & D, R & D personell and man-years, by industry. 2008 and 2009. NOK million and number [Corrected 10 February 2011 at 1445]
- Table 3 R & D personnel and R & D man-years in Business Enterprise sector, by industry and size class. 2008. Number
- Table 4 Intramural R & D expenditures in Business Enterprise sector, by industry and size class. 2009. NOK million
- Table 5 Funding of R & D expenditures in the in Business Enterprise Sector, by source, industry and size class. 2009. NOK million
- Table 6 Extramural R & D in Business Enterprice sector, by industry and size class. 2009. NOK million
- Table 7 Intramural R & D expenditure, by technology field and industry. 2009. NOK million [Corrected 10 February 2011 at 1445]
- Table 8 Intramural R & D expenditure, by selected thematic field and industry. 2009. NOK million [Corrected 10 February 2011 at 1445]
Find more figures
Find detailed figures for Research and development in the business enterprise sector
Contact
-
Kristine Langhoff
E-mail: kristine.langhoff@ssb.no
tel.: (+47) 40 90 24 39
-
Claudia Berrios
E-mail: claudia.berrios@ssb.no
tel.: (+47) 40 90 24 51
-
Harald Fondevik
E-mail: harald.fondevik@ssb.no
tel.: (+47) 40 90 24 47


