Content
Published:
This is an archived release.
No growth in purchase of R&D services
Norwegian business enterprises spent NOK 18.5 billion on intramural research and development (R&D) in 2010. In addition, the enterprises purchased external R&D services for NOK 5.4 billion in 2010; a nominal decrease of 3 per cent.
The final figures for intramural R&D for 2010 differ just slightly from the preliminary figures published in October 2011. R&D activity in business enterprises is stable compared with 2009, with a small reduction in R&D expenditure in fixed prices. There has also been a small decline in R&D personnel and performed R&D man-years.
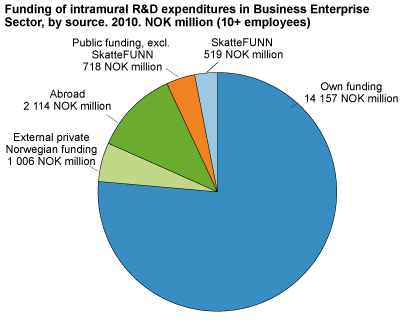
Business enterprises funded 76 per cent of their R&D activity with own funds. Funding structure is generally stable from one year to the next. Public funding (including the tax reduction scheme SkatteFUNN) made up 7 per cent of the intramural R&D expenditure in the business enterprise sector. Funding from abroad accounted for 11 per cent.
Reduced purchase of R&D services
Business enterprises spent NOK 5.4 billion on extramural R&D in 2010 (enterprises with at least 10 employees). This is a decrease of NOK 174 million or 3 per cent compared with 2009.
Business enterprises acquired R&D services from research institutes, universities and colleges in Norway for NOK 1.2 billion in 2010. This corresponds to the level in 2008, but is NOK 331 million lower than in 2009. Acquisition of R&D services from abroad has remained stable at almost NOK 2.2 billion, representing 40 per cent of the business enterprise sector’s total extramural R&D. Of this, foreign enterprises in their own corporate group made up almost NOK 1.2 billion.
Extraction of petroleum and gas is the industry with the highest purchase of external R&D services, at almost NOK 1.7 billion in 2010. This is more than the industry's intramural R&D expenditure. In the manufacturing industries, the pharmaceutical industry acquires a relatively high amount of R&D services. Extramural R&D accounted for 60 per cent of the intramural R&D expenditure. For all manufacturing industries, the proportion is 21 per cent on average. The proportion for the service industries was overall the same, but there are considerable variations between the different industries.
More R&D in ICT and biotechnology
A large part of R & D activities in the business enterprise sector is related to information and communication technology (ICT). Business enterprises spent NOK 7.5 billion on ICT-related R&D in 2010, and this amounted to more than 44 per cent of total current costs for R&D. The share was three percentage points higher than in 2009. Current costs for R&D related to biotechnology amounted to almost NOK 1.2 billion in 2010 and has increased by 10 per cent compared with 2009. There was a slight decline for nano technology, other material technology and other technology areas.
High level of R&D activity in energy
Energy stands out as the most important thematic field of ’business enterprises’ R&D efforts. Twenty-six per cent of total current costs for intramural R&D were energy related in 2010. Within this field, R&D worth NOK 4.5 billion was performed, which is 4 per cent less than the year before. The R&D expenditure of NOK 3.1 billion in the petroleum activity accounts for a large share of energy-related R&D. Renewable energy R&D amounted to NOK 803 million. For environmental research, NOK 735 million was spent, which accounted for 4 per cent of total operating costs for R&D.
Health is another important thematic field, and R&D worth NOK 1.5 billion was performed in this field, which is an increase of 5 per cent compared with 2009. The pharmaceutical industry accounted for 30 per cent of R&D activity in health.
About the dataThe R&D statistics are based on information collected from all enterprises with 50 employees or more. In addition, a sample of enterprises with 5-49 employees is drawn and total figures for this group are calculated based on this sample. As a result, there is greater uncertainty surrounding the results for the small enterprises. Due to comparability over time and international comparisons, the figures for the business sector cover enterprises with at least 10 employees, unless otherwise stated. |
Tables:
- Table 1 Intramural and extramural R & D expenditure, R & D-personnel and R & D man-years by Industry and size class. 2008-2010. NOK million and number of.
- Table 2 Intramural and extramural R & D expenditure, R & D personell and man-years by Industry. 2009 and 2010. NOK million and number of. (10+ employees)
- Table 3 R & D personnel and R & D man-years by Industry and size class. 2010. Number of. (10+ employees)
- Table 4 Intramural R & D expenditures by Industry and size class. 2010. NOK million. (10+ employees)
- Table 5 Funding of R & D expenditures by source, Industry and size class. 2010. NOK million. (10+ employees)
- Table 6 Funding of R & D expenditures, by source and Industry. 2010. NOK million. (10+ employees)
- Table 7 Extramural R & D by Industry and size class. 2010. NOK million. (10+ employees)
- Table 8 Extramural R & D by Industry. 2010. NOK million. (10+ employees)
- Table 9 Intramural R & D expenditure, by technology field and Industry. 2010. NOK million. (10+ employees)
- Table 10 Intramural R & D expenditure by selected thematic field and Industry. 2010. NOK million. (10+ employees)
Find more figures
Find detailed figures for Research and development in the business enterprise sector
Contact
-
Kristine Langhoff
E-mail: kristine.langhoff@ssb.no
tel.: (+47) 40 90 24 39
-
Claudia Berrios
E-mail: claudia.berrios@ssb.no
tel.: (+47) 40 90 24 51
-
Harald Fondevik
E-mail: harald.fondevik@ssb.no
tel.: (+47) 40 90 24 47

