Content
Published:
This is an archived release.
Highest R&D growth in Norway
Norwegian business enterprises reported a total of NOK 17.5 billion in research and development (R&D) expenditure in 2007; an increase of NOK 2.3 billion compared with 2006. This equals an increase of 15 per cent in nominal value, or 11 per cent in fixed prices, which is markedly higher than within the EU and the other Nordic countries.
The number of R&D man-years increased by 6 per cent; from 14 395 in 2006 to 15 262 in 2007. The share of enterprises with R&D activity is 16 per cent; the same level as in 2006.
The largest increase in R&D expenditure was in other current costs. Other current costs increased by 21 per cent compared with 2006, to NOK 5.6 billion in 2007. In comparison, costs for compensation of employees increased by 12.5 per cent. The average costs for compensation of employees have therefore increased by 6 per cent from 2006. Investments in R&D equipment increased by 14 per cent from 2006, and make up 7 per cent of total R&D costs.
The business enterprise sector expects a certain growth in R&D activity for 2008. An estimate made by the enterprises in the second quarter of 2008 indicates growth of 4 per cent in R&D man-years, and a 6 per cent increase in nominal R&D expenditure.
Norwegian business enterprises spent nearly NOK 4.9 billion on extramural R&D services in 2007; an increase of 29 per cent compared with 2006.
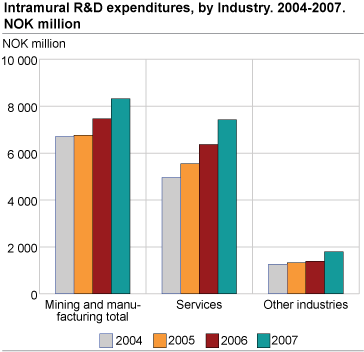
Increase in R&D expenditure both in the manufacturing and the service industry in 2007
R&D expenditure in the service industry has increased by NOK 1 billion since 2006, which is equivalent to 16 per cent growth. R&D in the manufacturing industry has increased by 11 per cent and manufacturing is still the largest R&D contributor making up 47 per cent of total R&D expenditure in 2007. The service industry now makes up 42 per cent of total R&D.
The number of R&D man-years increased by 10 per cent in the service industry and 18 per cent in other industries (including oil and gas extraction) compared to 2006. The number of R&D man-years in the manufacturing industry remained unchanged.
Growth for all enterprise classes
When sorted by number of employees, all classes of enterprises experienced growth in R&D expenditure in 2007. The largest enterprises, with more than 500 employees, had an increase of 14 per cent and account for 42 per cent of total R&D. These enterprises have also had the largest growth in R&D in recent years, but in 2007 enterprises with less than 500 employees also had a marked increase. For enterprises with 50-499 employees, the R&D expenditure was 21 per cent higher than in 2006. Enterprises with 10-49 enterprises had a 9 per cent increase in R&D expenditure, and make up 24 per cent of total R&D in 2007.
About the dataThe R&D statistics are based on information collected from the enterprises. All enterprises with 50 employees or more are included. In addition, a sample of enterprises with 10-49 employees is drawn and total figures for this group are calculated based on this sample. As a result, there is greater uncertainty surrounding the results for the small enterprises. |
Total R&D and international comparison
With regard to the overall R&D in universities, colleges and research institutes, preliminary figures for total R&D expenditure amounted to NOK 37.6 billion in 2007. This represents a nominal increase of 15 per cent from 2006. Total R&D as a percentage of GDP was then 1.65 per cent in 2007; an increase compared with 1.52 per cent for 2006. For comparison, the share of GDP was 1.83 in the EU countries in 2007, which was the same as in 2006. The 15 per cent increase in R&D expenditure in the business enterprise sector in Norway was considerably higher than the growth in EU countries, with the average growth being 5 per cent. Among the Nordic countries, the growth in Finland and Denmark was 10 and 3 per cent respectively, while in Sweden there was no change from 2006 to 2007.
More detailed results are available in Statbank on our home page: http://statbank.ssb.no/statistikkbanken/ .
Tables:
- Table 1 R & D in Business Enterprise Sector. Intramural and Extramural R & D, R & D-personnel and R & D man-years, by Industry and size class 2005- 2007 . NOK million and number of
- Table 2 R & D in Business Enterprise Sector. Intramural and extramural R & D, R & D personell and man-years, by Industry. 2006 and 2007. NOK million and number of
- Table 3 Intermural R & D expenditures in the Business Enterprise Sector, type of costs and number of R & D enterprises by Industry and size class. 2007. NOK million
Find more figures
Find detailed figures for Research and development in the business enterprise sector
Contact
-
Kristine Langhoff
E-mail: kristine.langhoff@ssb.no
tel.: (+47) 40 90 24 39
-
Claudia Berrios
E-mail: claudia.berrios@ssb.no
tel.: (+47) 40 90 24 51
-
Harald Fondevik
E-mail: harald.fondevik@ssb.no
tel.: (+47) 40 90 24 47

