Content
Published:
This is an archived release.
Increase in R&D in service industries
Norwegian business enterprises reported a total of NOK 19 billion in research and development (R&D) expenditure in 2008. This is an increase of NOK 1.6 billion, or 9 per cent compared with 2007. The increase in fixed prices was 5 per cent. The final figures are slightly higher than preliminary figures published in October 2009.
In addition, a further NOK 1.5 billion in intramural R&D expenditure was reported from enterprises with 5-9 employees. The total R&D expenditure for all business enterprises for 2008 thus amounts to almost NOK 20.5 billion. Enterprises with 5-9 employees were also included in the 2006 survey, in which they reported NOK 1.1 billion in R&D expenditure.
The number of R&D man-years increased by 7.7 per cent; from 15 304 in 2007 to 16 479 in 2008. Seventy per cent of the man-years were performed by personnel with higher education. There were 23 959 persons involved in R&D activity in 2008 in total; an increase of 9.4 per cent compared with 2007. Enterprises with 5-9 employees reported in addition 1 511 R&D man-years and 2 795 persons involved in R&D activity.
Largest increase in compensation of employees
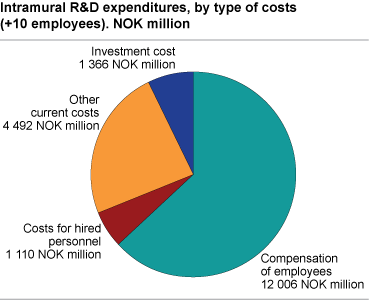
Of the R&D expenditure, the compensation of employees increased more than current costs and investments. Costs for compensation of employees increased by 13 per cent, and make up NOK 12 billion of total R&D costs. The average costs for compensation of employees have therefore increased by 4.6 per cent from 2007.
Service industries had largest growth
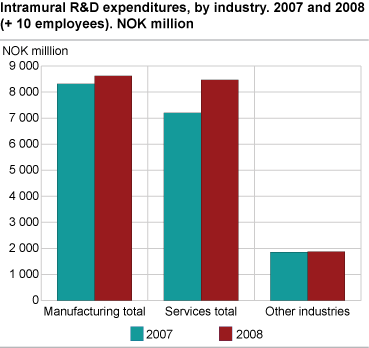
The service industries spent almost NOK 8.5 billion on R&D in 2008; an increase of 17.6 per cent compared with 2007. In comparison, the manufacturing industries had NOK 8.6 billion in R&D expenditure, but this is only 3.7 per cent higher than the expenditure in 2007. The manufacturing industries made up 45.5 per cent of total R&D expenditure in 2008. The service industries contributed with 44.6 per cent and other industries1 made up 9.9 per cent of total R&D expenditure.
The service industries also contributed most to the increase of R&D man-years in the business enterprise sector, with an increase of 15.4 per cent from 2007 to 2008. The manufacturing enterprises only had a marginal rise. A consequence of this is that there were more R&D man-years in the service industries than in the manufacturing industries. A total of 7 341 R&D man-years were carried out in the manufacturing industries and 7 958 man-years in service industries in 2008.
The large growth in the service industries is due to the long-term trend. The service industries have contributed with most of the growth in the R&D activity in the business enterprise sector in recent years.
Funding of R&D
Internal funding accounted for 75 per cent of the enterprises’ intramural R&D expenditures in 2008. This is 1 percentage point lower than in 2007. The enterprises in the service industries increased their degree of internal funding by 2.1 percentage points to 73.7 per cent. Manufacturing enterprises had a reverse development. In these enterprises, internal funding accounted for 75 per cent; a decrease of 3.2 percentage points. Total public spending made up 7.6 per cent. The contribution of SkatteFUNN accounted for 2.5 percentage points of this. The rest of the funding was mainly covered by external private funding, including enterprises in the same enterprise group. Funding from abroad made up 11 per cent.
Increased extramural R&D
Norwegian business enterprises spent nearly NOK 5.4 billion on extramural R&D services in 2008; an increase of 12.5 per cent compared with 2007. There was a large growth in the purchase of R&D services from research institutes and universities in Norway and other enterprises within the same corporate group abroad.
In 2008, the extramural R&D increased most in the other industries, by 24.1 per cent. This is largely due to the extraction of oil and gas. The service industries increased by 3.1 per cent, while the manufacturing industries increased by 10.4 per cent.
In 2007, the extramural R&D was approximately equally distributed between the service industries, manufacturing industries and other industries. The amount of extramural R&D was then about NOK 1.6 billion in each of the three groups.
New industry classification
Since the statistical year 2008, a new version of Norwegian industry classification (SIC2007) has been in use. One important change is that publishing and recycling are no longer classified as manufacturing industry. The transition to the new industry classification makes it difficult to compare figures for 2008 with figures for earlier years. There is some enhanced covering of the industries in the 2008 survey. The population for the 2007 survey has been adjusted slightly in order to make it easier to compare 2007 and 2008. This means that the figures for 2007 may differ slightly from previously published figures. This is a link to a general overview of the transition to the new industry classification.
About the dataThe R&D statistics are based on information collected from the enterprises. All enterprises with 50 employees or more are included. In addition, a sample of enterprises with 5-49 employees is drawn and total figures for this group are calculated based on this sample. As a result, there is greater uncertainty surrounding the results for the small enterprises. It must be emphasised that the figures in this article are preliminary and can be changed. |
1These other industries include the enterprise groups B: Mining and quarrying, D: Electricity and gas supply, E: Water supply, sewerage, waste, F: Construction, and 03 Fishing and aquaculture.
Tables:
- Table 1 R & D in Business Enterprise Sector. Intramural and Extramural R & D, R & D-personnel and R & D man-years, by Industry and size class 2007 and 2008 . NOK million and number of
- Table 2 R & D in Business Enterprise Sector. Intramural and extramural R & D, R & D personell and man-years, by Industry. 2008 (+10 employees). NOK million and number of
- Table 3 R & D personnel and R & D man-years in Business Enterprise sector by Industry and size class. 2008 (+10 employees). Number of
- Table 4 Intramural R & D expenditures in Business Enterprise sector, by Industry and size class. 2008 (+10 employees). NOK million
- Table 5 Funding of R & D expenditures in the in Business Enterprise Sector, by source, Industry and size class. 2008 (+10 employees). NOK million
- Table 6 Extramural R & D in Business Enterprice sector, by Industry and size class(+ 10 employees). 2008. NOK million
- Table 7 Intramural R & D expenditure by technology field, Industry and size classes (+10 employees). 2008. NOK million
- Table 8 Intramural R & D expenditure, by selected thematic field, Industry and size class. 2008. (+10 employees) NOK million
Find more figures
Find detailed figures for Research and development in the business enterprise sector
Contact
-
Kristine Langhoff
E-mail: kristine.langhoff@ssb.no
tel.: (+47) 40 90 24 39
-
Claudia Berrios
E-mail: claudia.berrios@ssb.no
tel.: (+47) 40 90 24 51
-
Harald Fondevik
E-mail: harald.fondevik@ssb.no
tel.: (+47) 40 90 24 47


