Content
Published:
This is an archived release.
Growth in R&D expenditure
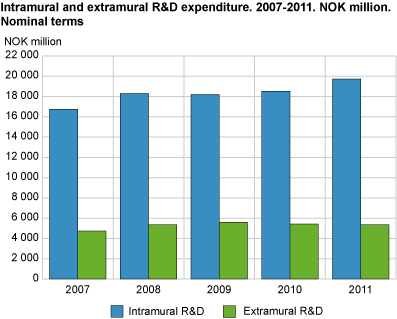
Norwegian business enterprises carried out research and development (R&D) totalling NOK 19.7 billion in 2011. After a couple of years with stagnation, this is an increase of nearly 7 per cent from 2010, and almost 3 per cent growth in fixed prices. A total of 15 500 R&D man-years were carried out in 2011; an increase of 1 per cent.
Preliminary figures for 2011 thus show a stronger growth in R&D expenditure than in R&D man-years from 2010. Enterprises expect stability in 2012. Estimates given in the second quarter of 2012 indicate unchanged R&D man-years and a small decrease in R&D expenditure. It is worth noting that the estimates are often lower than the final results.
Highest increase in compensation of employees and costs for contracted R&D personnel
Compensation of employees and costs for contracted R&D personnel contributed most to the growth in total R&D expenditure. Compensation of employees increased by NOK 560 million, and accounted for 64 per cent of total R&D expenditure in 2011. Business enterprises spent NOK 1.6 billion on contracted R&D personnel; an increase of NOK 315 million compared with 2010. Other current costs and investments in machinery and buildings saw somewhat weaker growth, with other current costs amounting to NOK 4.1 billion and R&D related investments amounting to NOK 1.4 billion in 2011.
Growth in manufacturing and service industries
Manufacturing enterprises carried out R&D totalling NOK 7.5 billion; an increase of 7 per cent compared with 2010. However, the number of R&D man-years in the manufacturing industries remained approximately unchanged. The R&D expenditure in service industries increased by nearly 10 per cent, and the number of R&D man-years increased by 4 per cent. R&D expenditure in the service industries accounted for 53 per cent of total R&D expenditure in the business enterprise sector in 2011. Enterprises in other industries1(including extraction of petroleum and gas) had a reduction in their R&D activity, with R&D expenditure decreasing by 9 per cent and amounting to NOK 1.8 billion in 2011.
Enterprises with at least 50 employees carried out R&D totalling almost NOK 15.3 billion, or 77 per cent of total R&D expenditures in the business enterprise sector. These enterprises had a growth of 9 per cent from 2010, while enterprises with 10-49 employees had a slight decline overall. The number of R&D man-years also increased for enterprises with at least 50 employees and was reduced for enterprises with 10-49 employees.
Purchase of R&D services from others fell slightly
In addition to carrying out their own R&D; enterprises purchase R&D services from others, both from other enterprises and from research institutes and universities. R&D services totalling NOK 5.4 billion were purchased in 2011; a decrease of 1 per cent from 2010. The expenditures that business enterprises spent on extramural R&D services in 2011 amounted to 27 per cent of the expenditures of intramural R&D. Other industries (including extraction of petroleum and gas) stand out as having higher expenditures for purchased R&D than R&D they carry out themselves, and purchased NOK 1.9 billion worth of such services in 2011. However, this is a decrease of 4.6 per cent from the year before.
About the dataThe R&D statistics are based on information collected from the enterprises. All enterprises with 50 employees or more are included. In addition, a sample of enterprises with 10-49 employees is drawn and total figures for this group are calculated based on this sample. As a result, there is greater uncertainty surrounding the results for the small enterprises. In the preliminary figures, complete entries from some large R&D enterprises are missing, and the entries for these enterprises are therefore estimated. |
1Other industries include the enterprise groups Extraction of petroleum and gas, Mining, Fishing and aquaculture, Electricity and gas supply, Water supply, sewerage, waste and Construction.
Tables:
- Table 1 R & D in Business Enterprise Sector. Intramural and extramural R & D expenditure, R & D-personnel and R & D man-years by Industry and size class. 2008-2011. NOK million and number of
- Table 2 Intramural R & D expenditures in Business Enterprise sector by type of costs, Industry and size class. 2011. NOK million
Find more figures
Find detailed figures for Research and development in the business enterprise sector
Contact
-
Kristine Langhoff
E-mail: kristine.langhoff@ssb.no
tel.: (+47) 40 90 24 39
-
Claudia Berrios
E-mail: claudia.berrios@ssb.no
tel.: (+47) 40 90 24 51
-
Harald Fondevik
E-mail: harald.fondevik@ssb.no
tel.: (+47) 40 90 24 47

