Content
Published:
This is an archived release.
Stagnated use of public electronic services
The proportion of enterprises which use public electronic services is stable compared to last year. About 70 per cent of enterprises have adopted the most popular public electronic services. Two out of three users were satisfied or very satisfied with the quality.
The proportion of enterprises which used Internet for information search on the homepages of public authorities in 2006, was approximately the same as in 2005. In both years about 70 per cent of the enterprises used the service. The proportion of enterprises which reported information to public authorities via Internet, has increased over 150 per cent since 2003. In 2003 2 out of 10 enterprises sent in data in web format. Three years later 6 out of 10 sent in data in web format. Between 2005 and 2006 the proportion of enterprises, which used Internet for reporting was stable, about 60 per cent.
In 2006 a little less than 70 per cent of the enterprises downloaded forms from the Internet. In comparison to 2003 this figure corresponds to an increase of over 50 per cent. In that year 45 per cent of the enterprises used Internet for downloading forms. Usage of this public electronic service did also not increase between 2005 and 2006.
2 out of 3 users are satisfied or very satisfied
Enterprises were asked about their evaluation of the quality of four electronic services (information search on the homepages of public authorities, downloading forms, sending in information in web format and submitting a proposal via an electronic tender system). Two out of three enterprises stated that they were satisfied or very satisfied. No employment groups or areas of industry stood out with large variance from this average, between 60 and 70 per cent was satisfied/very satisfied.
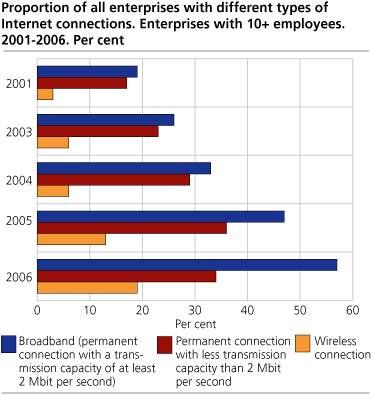
60 per cent has broadband
A commonly used definition of broadband is transmission capacity of at least 2 Mbit per second. This survey asked enterprises if they were connected to Internet via various DSL-technologies or other types connections with capacity of ay least 2 Mbit per second. Since 2001 the proportion of enterprises connected to Internet via broadband has increased with 200 per cent. Six out of ten enterprises are now connected to the Internet with a broadband connection. In the same period the proportion enterprises with wireless connection to Internet more than quintupled. In this survey the transmission capacity of wireless Internet connections was not specified. Because several enterprises have more than one type connection to the Internet, proportions for Internet connections do not correspond to the proportion for Internet access.
Sales via the Internet made up almost NOK 100 billion
In 2005 total sales via Internet among enterprises with at least ten employees came to almost NOK 100 billion, or about six per cent of total turnover. Since the calculation of Internet turnover is based on observations with great variation, the uncertainty is larger than for results presented in proportions. Uncertainty in the data can bring large yearly fluctuations. In this publication Statistics Norway has not included financial intermediation in the volume of Internet turnover.
Many other European countries produce statistics about ICT usage in enterprises in cooperation with EUs statistical office Eurostat. The plan for this survey is adapted to Eurostat guidelines. Internationally comparable figures can be found here .
Tables:
- Table 1 Proportion of all enterprises with Internet access, by employment groups, area of industry and counties. 1998-2006. Per cent
- Table 2 Proportion of all small enterprises (5-9 employees) with Internet access, by area of industry. 2001-2006. Per cent
- Table 3 Proportion of all enterprises with different types of Internet connections, by employment groups and area of industry. 2006. Per cent
- Table 4 Proportion of all small enterprises (5-9 employees) with different types of Internet connections, by area of industry. 2006. Per cent
- Table 5 Proportion of all enterprises with broadband, by employment groups and area of industry. 2001-2006. Per cent
- Table 6 Proportion of all enterprises with permanent connection with less transmission capacity than 2 Mbit per second, by employment groups and area of industry. 2001-2006. Per cent
- Table 7 Proportion of all enterprises with homepage, by employment groups, area of industry and counties. 1998-2006. Per cent
- Table 8 Internet sales. Proportion of all enterprises with turnover from sales via Internet. Enterprises with 10+ employees. 1998-2005. Per cent
- Table 9 Volume of Internet sales, by employment groups and area of industry. 1999-2005. Billion NOK
- Table 10 Proportion of all enterprises with various security measures. 2003-2006. Per cent
- Table 11 Proportion of all enterprises using Internet for dealing with public authorities, by employment groups, area of industry and counties. 2003-2006. Per cent
- Table 12 Enterprises's evaluation of the quality of public electronic services. Proportion of enterprises using Internet to communicate with public authorities (information search, downloading forms, sending in information in web format, submit a proposal in an elektronic tender system), by employment groups, area of industry and counties. 2005. Per cent
- Table 13 Proportion of all enterprises which used broadband telephony, by employment groups and area of industry. 2006. Per cent
Contact
-
Yun Walther-Zhang
E-mail: yun.walther-zhang@ssb.no
tel.: (+47) 40 90 25 38


