Content
Published:
This is an archived release.
Extensive exchange of electronic data
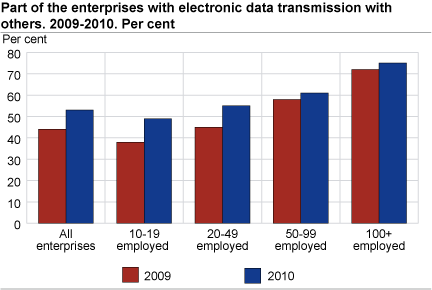
One out of two enterprises exchange electronic data with others. Large enterprises experienced more problems with their ICT systems and they also took more precautions to prevent such problems.
From 2009 to 2010 the share of enterprises that exchanged electronic data with others has increased from 44 to 53 per cent. This survey covers the enterprises with at least 10 persons employed. The largest increase has been among the smaller of these enterprises. The enterprises with 10-19 persons employed have increased from 38 to 49 per cent, while those with at least 100 persons employed has increased from 72 to 75 per cent. The difference between large and small enterprises is still substantial.
With regard to the different types of data exchange, we find that almost one out of two enterprises receive electronic invoices from other enterprises. An equal number send to or receive data from public government. Between 27 and 40 per cent of enterprises use electronic data exchange when they send or receive orders, send invoices, send or receive transport documents and send payment instructions to the bank. The large enterprises use all of these types more often than smaller ones. The differences between enterprises in different industries vary considerably. Some of the differences are probably due to different needs for this kind of data exchange. For example, only 25 per cent of the enterprises in the retail trade industry send electronic invoices compared to 47 per cent within the wholesale trade industry. This difference relates to the more common use of cash payment in retail trade businesses. Regarding received invoices, more than 50 per cent of both retail and wholesale trade businesses are using electronic data exchange.
One out of four enterprises share electronic information regarding the supply chain management with suppliers or customers. Here the differences by size are rather small while the trade industries are far ahead of the others. As could be expected, the contact with suppliers is much more extensive than with customers within the retail trade industry.
The use of information from purchase or sales orders to internal functions by electronic exchange varies considerably by enterprise size and by industry. Regarding the use of such information in accounting we find only small differences. This is the most commonly used of such electronically exchanged information, used by one out of two enterprises. Less than 30 per cent of enterprises use such information in the management of inventory levels.
Financial and insurance enterprises score high on ICT security
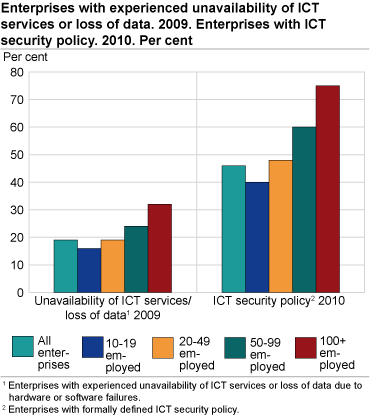
When answering our question on whether the enterprise has a formally defined ICT security policy with a plan of regular review, 46 per cent of enterprises replied in the affirmative. Seventy-five per cent of the largest enterprises gave the same answer. Almost all financial and insurance enterprises have such an ICT security policy.
Of the events we asked about that could seriously have affected the ICT system of the enterprise in the year 2009, only one was actually mentioned by more than a few per cent of enterprises. Unavailability of ICT services, destruction or corruption of data due to hardware or software failures was reported by 19 per cent of enterprises. Twice as many of the largest enterprises had experienced this than the smaller ones.
Regarding internal security facilities or procedures used, we find particularly high figures for offsite data backup (76 per cent), strong password authentication (55 per cent) and logging activities for analyses of security incidents (47 per cent). Financial and insurance enterprises are far ahead of the others with 98, 87 and 94 per cent respectively. The use of digital signature is commonly used only within the financial and insurance enterprises with 42 per cent, compared to 14 per cent in all enterprises.
| 2010 | 2009-2010 | ||||||||||||||||||||||||||||||||||||||||||||||||||||||||||||||||||||||||||||||
|---|---|---|---|---|---|---|---|---|---|---|---|---|---|---|---|---|---|---|---|---|---|---|---|---|---|---|---|---|---|---|---|---|---|---|---|---|---|---|---|---|---|---|---|---|---|---|---|---|---|---|---|---|---|---|---|---|---|---|---|---|---|---|---|---|---|---|---|---|---|---|---|---|---|---|---|---|---|---|---|
| Per cent | Per cent | ||||||||||||||||||||||||||||||||||||||||||||||||||||||||||||||||||||||||||||||
| Enterprises with at least 10 persons employed | |||||||||||||||||||||||||||||||||||||||||||||||||||||||||||||||||||||||||||||||
| Type of Internet connection1 | |||||||||||||||||||||||||||||||||||||||||||||||||||||||||||||||||||||||||||||||
| Fixed broadband connections with a transmission capacity of at least 2 Mbit/s | 70 | -2 | |||||||||||||||||||||||||||||||||||||||||||||||||||||||||||||||||||||||||||||
| Fixed broadband connections with less transmission capacity than 2 Mbit/s | 15 | -1 | |||||||||||||||||||||||||||||||||||||||||||||||||||||||||||||||||||||||||||||
| Mobile broadband only2 | 2 | 1 | |||||||||||||||||||||||||||||||||||||||||||||||||||||||||||||||||||||||||||||
| Non-broadband Internet connection2 | 10 | 2 | |||||||||||||||||||||||||||||||||||||||||||||||||||||||||||||||||||||||||||||
| Use of home page | |||||||||||||||||||||||||||||||||||||||||||||||||||||||||||||||||||||||||||||||
| Has homepage | 79 | 4 | |||||||||||||||||||||||||||||||||||||||||||||||||||||||||||||||||||||||||||||
| Home page with product catalogues or price lists | 43 | 7 | |||||||||||||||||||||||||||||||||||||||||||||||||||||||||||||||||||||||||||||
| Receive orders or reservations via home page | 35 | 5 | |||||||||||||||||||||||||||||||||||||||||||||||||||||||||||||||||||||||||||||
| 1 |
Net figures according to sorted connection (Fixed connection over 2 Mbit/s, under 2Mbit/s,
mobile broadband, non-broadband). |
| 2 |
Mobile broadband is measured separately from 2010. Calculated figure for only mobile
broadband at 1 per cent in 2009. |
Full stop in fixed broadband growth
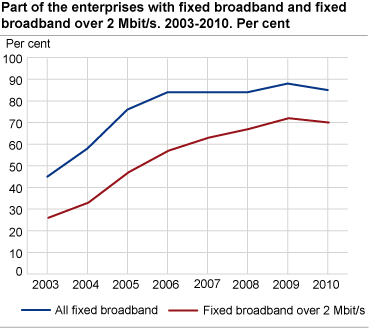
While 97 per cent of enterprises with at least 10 persons employed have Internet access in January 2010, 85 per cent has a fixed broadband connection. An additional 2 per cent has a mobile broadband connection only. The remaining 10 per cent has a non-broadband connection. The growth in numbers of fixed broadband connections culminated in 2006 and the growth in fixed connections with at least 2 Mbit/s culminated in 2009. Other statistics indicate that the number of all fixed business broadband connections culminated in 2009 and that the growth in transmission capacity continues. See the Internet survey http://www.ssb.no/inet_en/
Compared to last year, the share of enterprises with a homepage has increased from 75 to 79 per cent. In the same period, the share with a homepage with product catalogues or price lists has increased from 36 to 43 per cent. Even the part with homepages that offers online ordering, reservation or booking has increased from 30 to 35 per cent from 2009 to 2010.
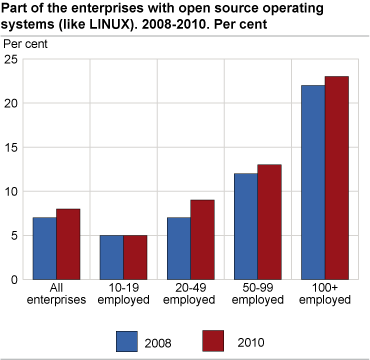
There is little change in the use of open source operating systems. Only 8 per cent of enterprises use this.
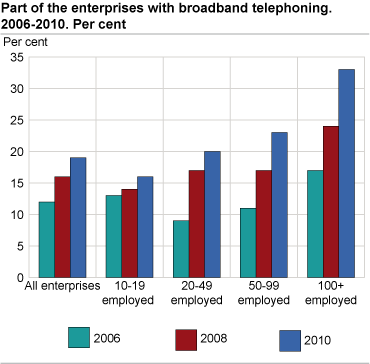
The share of enterprises using broadband telephony is increasing steadily from 12 per cent in 2006, to 16 per cent in 2008 and 19 per cent in 2010. The increase among the largest enterprises is the strongest from 17 per cent in 2006 to 33 per cent this year.
|
Many other European countries produce statistics about ICT usage in enterprises in cooperation with EU’s statistical office Eurostat. The plan for this survey is adapted to Eurostat guidelines. Internationally comparable figures can be found here: http://epp.eurostat.ec.europa.eu/portal/page/portal/information_society/introduction |
Tables:
- Table 1 Proportion of all enterprises with different types of Internet connections, by employment groups and area of industry. 2010. Per cent
- Table 2 Proportion of all enterprises which used Internet in various ways for dealing with public authorities, by employment groups and area of industry. 2009. Per cent
- Table 3 Enterprises's evaluation of the quality of public electronic services. Proportion of enterprises using Internet to communicate with public authorities (information search, downloading forms, sending in information in web format, full electronic case handling, submit a proposal in an elektronic tender system), by employment groups and area of industry. 2009. Per cent
- Table 4 Proportion of all enterprises with different types of electronic transmission of data with others, by employment groups and area of industry. 2010. Per cent
- Table 5 Proportion of all enterprises with different types of sharing of electronic information on supply chain management, by employment groups and area of industry. 2010. Per cent
- Table 6 Proportion of all enterprises that use information on purchase or sales orders to different functions, by employment groups and area of industry. 2010. Per cent
- Table 7 Proportion of all enterprises with a formally defined ICT security policy and different ways of making the staff aware of their obligation, by employment groups and area of industry. 2010. Per cent
- Table 8 Proportion of all enterprises with ICT related security incidents affecting the ICT system, by employment groups and area of industry. 2009. Per cent
- Table 9 Proportion of all enterprises that uses digital signature or different internal security facilities or procedures, by employment groups and area of industry. 2010. Per cent
- Table 10 Proportion of all enterprises offering services via homepages, by employment groups and area of industry. 2010. Per cent
Contact
-
Yun Walther-Zhang
E-mail: yun.walther-zhang@ssb.no
tel.: (+47) 40 90 25 38

