Content
Published:
This is an archived release.
Slow broadband growth due to technical adjustments
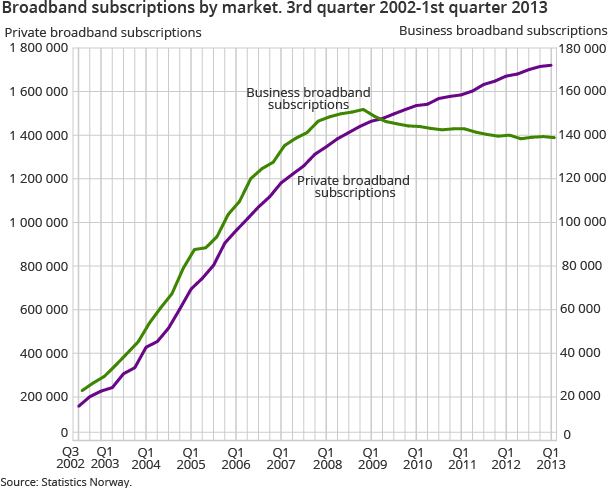
The number of private fixed broadband connections has increased by 6 000 in the last quarter. The average capacity of private fixed broadband access increased 28 per cent last year. For business broadband, the increase was 26 per cent.
| 1st quarter 2013 | 4th quarter 2012 | 1st quarter 2012 | 1st quarter 2012 - 1st quarter 2013 | ||
|---|---|---|---|---|---|
| Change | Change i per cent | ||||
| Fixed broadband | 1 856 774 | 1 851 606 | 1 808 196 | 48 578 | 2.7 |
| Private broadband | |||||
| Private broadband subscriptions | 1 721 667 | 1 716 000 | 1 671 911 | 49 756 | 3.0 |
| Private broadband subscriptions per 100 households | 76.2 | 76.7 | 74.7 | 1.5 | 2.0 |
| Average transmission capacity (Mbit/s) | 16.5 | 15.6 | 12.8 | 3.7 | 28.9 |
| Median transmission capacity (Mbit/s) | 9.1 | 8.6 | 7.2 | 1.9 | 26.4 |
| Business broadband | |||||
| Business broadband subscriptions | 135 107 | 135 606 | 136 285 | -1 178 | -0.9 |
| Average transmission capacity (Mbit/s) | 11.5 | 11.0 | 9.1 | 2.4 | 26.4 |
| Median transmission capacity (Mbit/s) | 5.5 | 5.3 | 4.4 | 1.1 | 25.0 |
The number of private broadband subscriptions with fixed access in Norway, including Svalbard, was 1 722 000 at the end of the 1st quarter of 2013; an increase of 50 000 subscriptions in the last 12 months. Compared to the previous quarter, this is an increase of 6 000 subscriptions. Some of the larger Internet service providers have reported a technical change in their reporting routines, causing a drop in their reported numbers of private subscriptions. In total, this amounts to less than 1 per cent of private broadband subscriptions, but the effects on local figures may be considerably larger.
The number of business subscriptions is stable at around 135 000.
Steady increase in broadband capacity
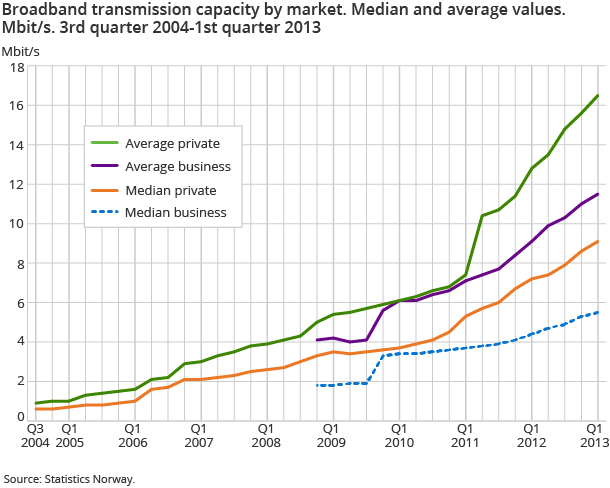
The average transmission capacity for fixed private broadband increased to 16.5 from 15.6 Mbit/s in the previous quarter. At the same time, the median value increased to 9.1 Mbit/s compared to 8.6 in the previous quarter. One year ago, the average transmission capacity was 12.8 Mbit/s and the median value was 7.2 Mbit/s.
The average transmission capacity for fixed business broadband increased to 11.5 from 11.0 Mbit/s in the previous quarter. At the same time, the median value increased to 5.5 Mbit/s compared to 5.3 in the previous quarter.
Private broadband subscriptions with a capacity of more than 8 Mbit/s total 53 per cent; an increase from 51 per cent in the previous quarter. Only 36 per cent of business broadband subscriptions have this capacity; an increase from 34 per cent in the previous quarter.
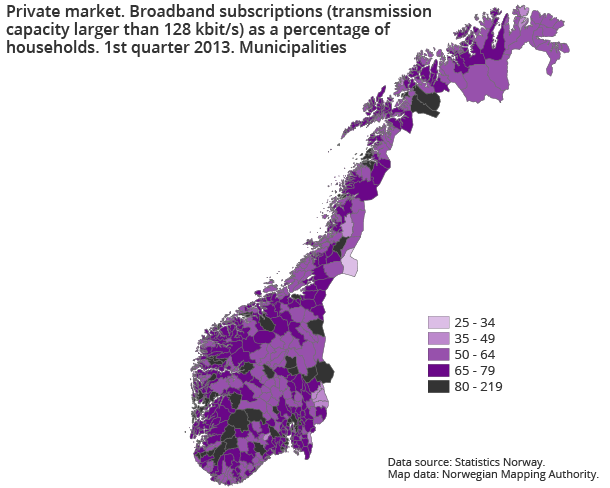
The broadband penetration rate in private households is 76 per cent, which is an increase from last year’s 75 per cent. The figure for private broadband subscriptions per 100 households varies between 85 per cent in the county of Oslo and 63 per cent in the county of Finnmark.
Not all providers are included Open and readClose
The number of Internet service providers reporting to this survey has been around 200 over the past few years. Market changes have reduced this number to around 170. A few small, but potentially locally important Internet service providers, mostly cable TV providers, may still not be included in the survey. Efforts have been made to include these providers. Some small errors related to the distribution of subscribers between municipalities may occur. This can have major consequences for the figures per household for some municipalities.
Contact
-
Statistics Norway's Information Centre
E-mail: informasjon@ssb.no
tel.: (+47) 21 09 46 42


