Content
Published:
This is an archived release.
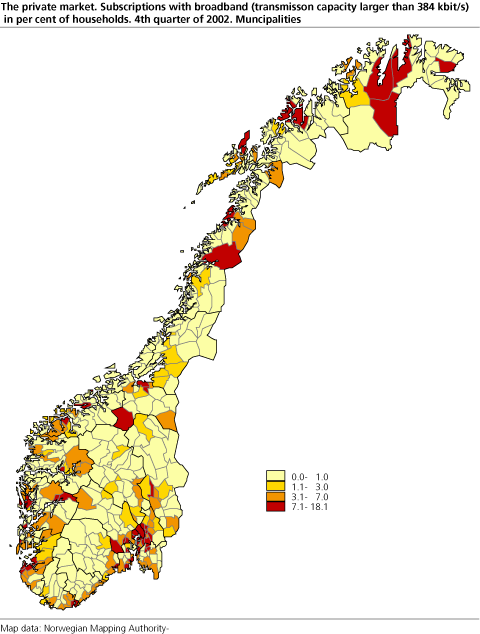
Broadband most common in central municipalities1
In the most central municipalities almost 10 of 100 households had a broadband subscription by the end of 2002. The corresponding figure for the least central municipalities was one of hundred households. At the same time the number of municipalities with no or few broadband subscriptions decreased.
By the end of 2002 the number of broadband subscriptions in Norway made up 158,000, an increase of almost 40 per cent since the end of the 3r d quarter.
The number of broadband subscriptions increased evenly during the year 2002. From the 1s t quarter to the 2n d the increase was 49 per cent, from the 2n d to the 3r d- 47 per cent and from the 3r d to the 4t h- 40 per cent. In this survey broadband is defined as Internet subscriptions with a transmission capacity (rate of speed in) larger than 384 kbit per second.
Minor changes in subscription types
By the end of the 4t h quarter of 2002 the number of Internet subscriptions in Norway amounted to 3.4 million. Only half of these were active, i.e. had been used during the last quarter or were broadband subscriptions.
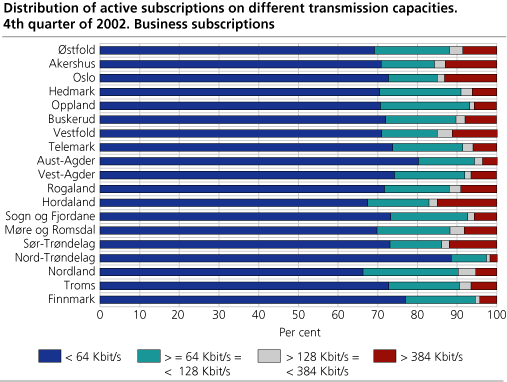
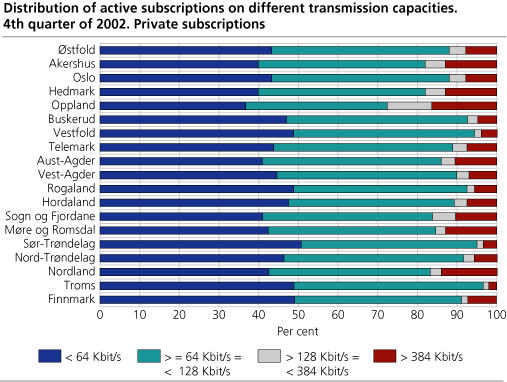
When the subscriptions are divided in different kinds of subscriptions, the difference between the business market and the private market is explicit. Subscriptions with an Internet connection via analogue modem and ISDN made up 72 and 15 per cent of all active subscriptions in the business market. For the private market these kinds of subscriptions constituted about 40 per cent each. This structure has been quite stable throughout the year. The portion of broadband subscriptions was by the end of the year about 10 per cent both in the business market and the private market. The growth has been most significant in the private market where the increase went from 7.4 per cent in the 3r d quarter to 9.7 per cent in the 4t h quarter.
More municipalities have broadband
While 280 of 434 municipalities had few or no broadband subscriptions by the end of the 3r d quarter, this figure decreased to 258 municipalities by the end of the 4t h quarter. The geographical distribution of broadband is among other things connected to the possibility of taking advantage of technologies like cable, ADSL, etc.
The statistics only include subscriptions provided by commercial Internet service providers.
In some cases the municipalities provide free Internet for the inhabitants. An example is the municipality of Modalen where all households are offered broadband. This kind of subscriptions is not included in the statistics.
|
Municipalities with most private broadband
subscriptions by the end of 4th quarter 2002 in per cent of households 3 November 2001. Only commercial Internet Service Providers are included. |
| Municipalities |
Broadband subscriptions
in per cent of households |
||||||||||||||||||||||||||||||||||||||
|---|---|---|---|---|---|---|---|---|---|---|---|---|---|---|---|---|---|---|---|---|---|---|---|---|---|---|---|---|---|---|---|---|---|---|---|---|---|---|---|
| Landsgjennomsnitt | 7.1 | ||||||||||||||||||||||||||||||||||||||
| 1233 Ulvik | 18.1 | ||||||||||||||||||||||||||||||||||||||
| 0219 Bærum | 17.2 | ||||||||||||||||||||||||||||||||||||||
| 1419 Leikanger | 15.4 | ||||||||||||||||||||||||||||||||||||||
| 1601 Trondheim | 14.8 | ||||||||||||||||||||||||||||||||||||||
| 0217 Oppegård | 13.5 | ||||||||||||||||||||||||||||||||||||||
| 1201 Bergen | 13.5 | ||||||||||||||||||||||||||||||||||||||
| 1502 Molde | 12.9 | ||||||||||||||||||||||||||||||||||||||
| 0301 Oslo | 12.6 | ||||||||||||||||||||||||||||||||||||||
| 1833 Rana | 12.1 | ||||||||||||||||||||||||||||||||||||||
| 1234 Granvin | 11.8 | ||||||||||||||||||||||||||||||||||||||
| 1804 Bodø | 11.8 | ||||||||||||||||||||||||||||||||||||||
| 0706 Sandefjord | 11.7 | ||||||||||||||||||||||||||||||||||||||
| 1634 Oppdal | 11.6 | ||||||||||||||||||||||||||||||||||||||
| 1103 Stavanger | 11.5 | ||||||||||||||||||||||||||||||||||||||
| 0220 Asker | 10.9 | ||||||||||||||||||||||||||||||||||||||
| 1221 Stord | 10.9 | ||||||||||||||||||||||||||||||||||||||
| 0231 Skedsmo | 10.5 | ||||||||||||||||||||||||||||||||||||||
| 0233 Nittedal | 10.4 | ||||||||||||||||||||||||||||||||||||||
| 0213 Ski | 10.3 | ||||||||||||||||||||||||||||||||||||||
| 2021 Kárásjohka-Karasjok | 10.3 | ||||||||||||||||||||||||||||||||||||||
In order to see the correlation between the centrality of the municipalities and the number of broadband subscriptions, it can be useful to classify the municipalities by Statistics Norway's Standard Classification of Municipalities. Clearly, the most central municipalities have the highest number of broadband subscriptions relative to the number of households.
|
Private broadband subscriptions 4th quarter, by centrality of
the municipalities |
| Centrality1 |
Households
November 2001 |
Broadband
subscriptions |
Broadband
subscriptions per cent of households |
||||||||||||||||||||||||||||||||||||
|---|---|---|---|---|---|---|---|---|---|---|---|---|---|---|---|---|---|---|---|---|---|---|---|---|---|---|---|---|---|---|---|---|---|---|---|---|---|---|---|
| Remote municipalities | 263 027 | 3 020 | 1.1 | ||||||||||||||||||||||||||||||||||||
| Fairly remote municipalities | 140 423 | 4 285 | 3.1 | ||||||||||||||||||||||||||||||||||||
| Fairly central municipalities | 490 057 | 27 824 | 5.7 | ||||||||||||||||||||||||||||||||||||
| Central municipalities | 1 068 078 | 104 335 | 9.8 | ||||||||||||||||||||||||||||||||||||
| 1 | Standard Classification of Municipalities, 1994 (NOS C 192). |
Both private persons and businesses may have several Internet subscriptions and several private persons use the same subscription. The number of subscriptions is therefore not the same as the number of households/businesses with Internet access. When it comes to broadband, however, there is reason to expect an almost one-to-one relationship between subscriptions and households. This is why broadband subscriptions are displayed in per cent of households in the municipalities.
1New revised article is released 11 May 2004.
Tables:
- Table 1 Private Internet subscriptions. Subscription by transmission capacity and county. 4th quarter 2002
- Table 2 Business Internet subscriptions. Subscription by transmission capacity and county. 4th quarter 2002
- Table 3 Private Internet subscriptions. Development features. Subscription by transmission capacity and county. 1st, 2nd, 3rd and 4th quarter 2002
- Table 4 Business Internet subscriptions. Development features. Subscription by transmission capacity and county. 1st, 2nd, 3rd and 4th quarter 2002
- Table 5 Active Internet subscriptions totally and broadband. Business and private subscriptions, by municipality. 4th quarter 2002
Contact
-
Statistics Norway's Information Centre
E-mail: informasjon@ssb.no
tel.: (+47) 21 09 46 42