Content
Published:
This is an archived release.
Regional differences in fast broadband
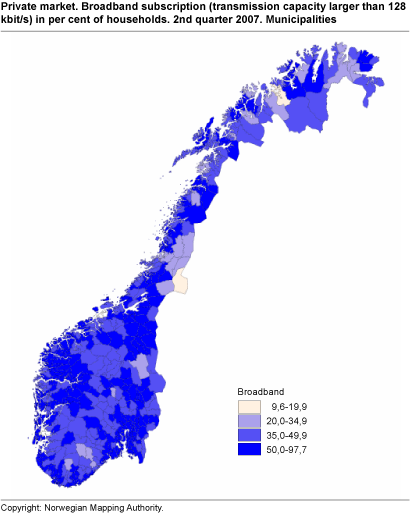
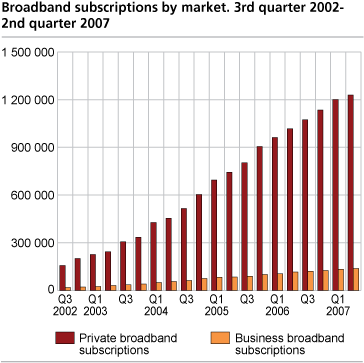
The number of broadband subscriptions was 1 368 000 at the end of the second quarter, an increase of 235 000 in the last twelve months. Only two municipalities have less than 20 private broadband subscriptions per 100 households.
At the end of the second quarter of 2007, Norway had 1 230 000 private broadband subscriptions, an increase of 21 per cent compared with the second quarter of 2006. In the same period, the number of business broadband subscriptions increased by 19 per cent to 138 000. These figures indicate that the current trend of weaker growth in broadband subscriptions continues.
6 per cent of the private broadband subscriptions have a transmission capacity higher than 8 Mbit/s. In two of nineteen counties, Rogaland and Nord-Trøndelag, the share of high capacity subscriptions is 27 per cent.
| Centrality1 | Broadband subscriptions |
Broadband subscriptions in
per cent of households |
|||||||||||||||||||||||||||||||||||||
|---|---|---|---|---|---|---|---|---|---|---|---|---|---|---|---|---|---|---|---|---|---|---|---|---|---|---|---|---|---|---|---|---|---|---|---|---|---|---|---|
| Remote municipalities | 127 023 | 49 | |||||||||||||||||||||||||||||||||||||
| Fairly remote municipalities | 79 368 | 56 | |||||||||||||||||||||||||||||||||||||
| Fairly central municipalities | 292 069 | 57 | |||||||||||||||||||||||||||||||||||||
| Central municipalities | 731 003 | 63 | |||||||||||||||||||||||||||||||||||||
| 1 | Standard Classification of Municipalities, 1994 (NOS C 192). |
The most central municipalities have the highest number of broadband subscriptions relative to the number of households (63 per cent), while this figure is 49 per cent in less central municipalities.
Only two municipalities have less than 20 private broadband subscriptions per 100 households, compared with 17 one year ago. Furthermore, 24 municipalities had between 20 and 35 private broadband subscriptions per 100 households, compared with 131 municipalities last year.
A few small, but locally important Internet service providers, mostly cable-TV providers, are still not included in the survey. Efforts have been made to include these providers. Some small errors with regard to the distribution of subscribers between municipalities have been discovered. This may have strong effects on the figures per household for some municipalities.
| Municipalities |
Broadband subscriptions in
per cent of households |
||||||||||||||||||||||||||||||||||||||
|---|---|---|---|---|---|---|---|---|---|---|---|---|---|---|---|---|---|---|---|---|---|---|---|---|---|---|---|---|---|---|---|---|---|---|---|---|---|---|---|
| Average for all municipalities | 59.6 | ||||||||||||||||||||||||||||||||||||||
| 1252 Modalen | 93.4 | ||||||||||||||||||||||||||||||||||||||
| 0941 Bykle | 87.7 | ||||||||||||||||||||||||||||||||||||||
| 1121 Time | 81.5 | ||||||||||||||||||||||||||||||||||||||
| 1729 Inderøy | 77.8 | ||||||||||||||||||||||||||||||||||||||
| 1563 Sunndal | 76.1 | ||||||||||||||||||||||||||||||||||||||
| 0228 Rælingen | 74.7 | ||||||||||||||||||||||||||||||||||||||
| 1742 Grong | 73.0 | ||||||||||||||||||||||||||||||||||||||
| 1221 Stord | 72.5 | ||||||||||||||||||||||||||||||||||||||
| 1663 Malvik | 71.2 | ||||||||||||||||||||||||||||||||||||||
| 1103 Stavanger | 71.0 | ||||||||||||||||||||||||||||||||||||||
| 1122 Gjesdal | 71.0 | ||||||||||||||||||||||||||||||||||||||
| 0213 Ski | 70.5 | ||||||||||||||||||||||||||||||||||||||
| 0233 Nittedal | 70.4 | ||||||||||||||||||||||||||||||||||||||
| 0706 Sandefjord | 70.4 | ||||||||||||||||||||||||||||||||||||||
| 1124 Sola | 69.9 | ||||||||||||||||||||||||||||||||||||||
| 1702 Steinkjer | 69.8 | ||||||||||||||||||||||||||||||||||||||
| 1804 Bodø | 69.8 | ||||||||||||||||||||||||||||||||||||||
| 1232 Eidfjord | 69.6 | ||||||||||||||||||||||||||||||||||||||
| 1556 Frei | 69.4 | ||||||||||||||||||||||||||||||||||||||
| 0217 Oppegård | 68.7 | ||||||||||||||||||||||||||||||||||||||
| 1719 Levanger | 68.5 | ||||||||||||||||||||||||||||||||||||||
| 1714 Stjørdal | 68.3 | ||||||||||||||||||||||||||||||||||||||
| 1102 Sandnes | 68.1 | ||||||||||||||||||||||||||||||||||||||
| 1601 Trondheim | 68.0 | ||||||||||||||||||||||||||||||||||||||
|
Individuals and businesses may have several Internet subscriptions and several individuals may use the same subscription. The number of subscriptions is therefore not equivalent to the number of households/businesses with Internet access. A household can for instance get Internet access through an employer, educational institutions or by sharing access with other households. The survey ICT in households contains more information about households with Internet access. For more information, see About the statistics. |
Tables:
- Table 1 Private broadband subscriptions. Subscription by transmission capacity and county. 2nd quarter of 2007
- Table 2 Business broadband subscriptions. Subscription by transmission capacity and county. 2nd quarter of 2007
- Table 3 Development features. Broadband subscription by market. Active subscriptions only. The whole country
- Table 4 Broadband subscriptions (larger than 128 kbit1
Contact
-
Statistics Norway's Information Centre
E-mail: informasjon@ssb.no
tel.: (+47) 21 09 46 42


