Content
Published:
This is an archived release.
Two out of three have broadband access
Close to 65 per cent of Norwegian households have broadband access. The number of high-speed broadband subscriptions in private households is 10 per cent - compared to only 2 per cent of business broadband subscriptions.
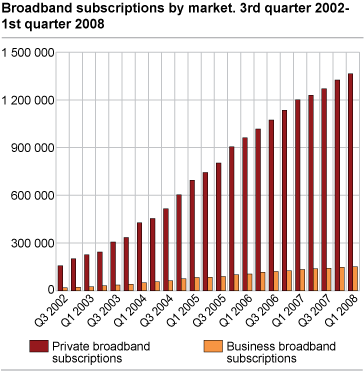
The number of broadband subscriptions was 1 515 000 at the end of the first quarter of 2008, an increase of 191 000 in the last twelve months.
At the end of the fourth quarter, Norway had 1 364 000 private broadband subscriptions, an increase of 15 per cent compared with the first quarter of 2007. In the same period, the number of business broadband subscriptions increased by 13 per cent to 151 000. This is the smallest increase to date both on an annual and quarterly basis.
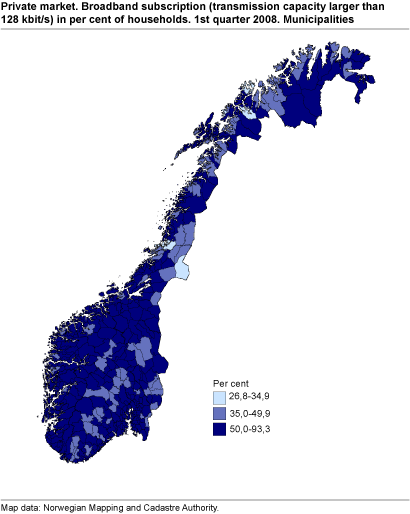
The broadband penetration rate in private households is now 64.8 per cent. The number of private broadband subscriptions per 100 households varies between 71 per cent in the county of Akershus, and 56 per cent in the county of Finnmark.
In total, 10 per cent of private broadband subscriptions have a download capacity higher than 8 Mbit/s. Only 2 per cent of business broadband subscriptions have this capacity. The number of broadband subscriptions with a download capacity lower than 512 kbit/s is only 1 per cent in the private market and 7 per cent in the business market.
| Centrality1 | Broadband subscriptions |
Broadband subscriptions
in per cent of households |
|||||||||||||||||||||||||||||||||||||
|---|---|---|---|---|---|---|---|---|---|---|---|---|---|---|---|---|---|---|---|---|---|---|---|---|---|---|---|---|---|---|---|---|---|---|---|---|---|---|---|
| Remote municipalities | 143 512 | 56 | |||||||||||||||||||||||||||||||||||||
| Fairly remote municipalities | 86 774 | 60 | |||||||||||||||||||||||||||||||||||||
| Fairly central municipalities | 317 958 | 63 | |||||||||||||||||||||||||||||||||||||
| Central municipalities | 808 464 | 68 | |||||||||||||||||||||||||||||||||||||
| 1 | Standard Classification of Municipalities, 1994 (NOS C 192). |
| Centrality1 | Broadband subscriptions |
Broadband subscriptions
in per cent of households |
|||||||||||||||||||||||||||||||||||||
|---|---|---|---|---|---|---|---|---|---|---|---|---|---|---|---|---|---|---|---|---|---|---|---|---|---|---|---|---|---|---|---|---|---|---|---|---|---|---|---|
| Remote municipalities | 109 506 | 56 | |||||||||||||||||||||||||||||||||||||
| Fairly remote municipalities | 76 664 | 61 | |||||||||||||||||||||||||||||||||||||
| Fairly central municipalities | 223 568 | 62 | |||||||||||||||||||||||||||||||||||||
| Central municipalities | 953 900 | 67 | |||||||||||||||||||||||||||||||||||||
| 1 | Centrality 2008, Municipalities 2008. |
The most central municipalities have the highest number of broadband subscriptions relative to the number of households (67 per cent), while this figure is 56 per cent in less central municipalities.
Only six municipalities have fewer than 35 private broadband subscriptions per 100 households. This is a decrease from 13 municipalities in the previous quarter.
|
A few small, but locally important Internet service providers, mostly cable-TV providers, are still not included in the survey. Efforts have been made to include these providers. Some small errors related to the distribution of subscribers between municipalities may occur. This may have strong effects on the figures per household for some municipalities. |
| Municipalities |
Broadband subscriptions
in per cent of households |
||||||||||||||||||||||||||||||||||||||
|---|---|---|---|---|---|---|---|---|---|---|---|---|---|---|---|---|---|---|---|---|---|---|---|---|---|---|---|---|---|---|---|---|---|---|---|---|---|---|---|
| Average for all municipalities | 64.8 | ||||||||||||||||||||||||||||||||||||||
| 0941 Bykle | 93.3 | ||||||||||||||||||||||||||||||||||||||
| 1252 Modalen | 91.5 | ||||||||||||||||||||||||||||||||||||||
| 1121 Time | 88.1 | ||||||||||||||||||||||||||||||||||||||
| 0544 øystre Slidre | 83.4 | ||||||||||||||||||||||||||||||||||||||
| 0219 Bærum | 80.6 | ||||||||||||||||||||||||||||||||||||||
| 1563 Sunndal | 77.5 | ||||||||||||||||||||||||||||||||||||||
| 1221 Stord | 76.8 | ||||||||||||||||||||||||||||||||||||||
| 1804 Bodø | 76.5 | ||||||||||||||||||||||||||||||||||||||
| 1122 Gjesdal | 75.3 | ||||||||||||||||||||||||||||||||||||||
| 0228 Rælingen | 75.2 | ||||||||||||||||||||||||||||||||||||||
| 0233 Nittedal | 75.1 | ||||||||||||||||||||||||||||||||||||||
| 1601 Trondheim | 75.1 | ||||||||||||||||||||||||||||||||||||||
| 0213 Ski | 74.8 | ||||||||||||||||||||||||||||||||||||||
| 1130 Strand | 74.4 | ||||||||||||||||||||||||||||||||||||||
| 1127 Randaberg | 74.0 | ||||||||||||||||||||||||||||||||||||||
| 0706 Sandefjord | 73.3 | ||||||||||||||||||||||||||||||||||||||
| 1103 Stavanger | 73.2 | ||||||||||||||||||||||||||||||||||||||
| 0217 Oppegård | 73.1 | ||||||||||||||||||||||||||||||||||||||
| 1502 Molde | 73.1 | ||||||||||||||||||||||||||||||||||||||
| 1924 Målselv | 72.8 | ||||||||||||||||||||||||||||||||||||||
| 0935 Iveland | 72.3 | ||||||||||||||||||||||||||||||||||||||
| 1222 Fitjar | 72.1 | ||||||||||||||||||||||||||||||||||||||
|
Individuals and businesses may have several Internet subscriptions and several individuals may use the same subscription. The number of subscriptions is therefore not equivalent to the number of households/businesses with Internet access. A household can for instance get Internet access through an employer, educational institution or by sharing access with other households. The survey ICT in households contains more information about households with at least one member under the age of 75 with Internet access. For more information, see About the statistics. |
Tables:
- Table 1 Private broadband subscriptions. Subscription by transmission capacity and county. 1st quarter of 2008
- Table 2 Business broadband subscriptions. Subscription by transmission capacity and county. 1st quarter of 2008
- Table 3 Development features. Broadband subscription by market. Active subscriptions only. The whole country
- Table 4 Broadband subscriptions (larger than 128 kbit1
Contact
-
Statistics Norway's Information Centre
E-mail: informasjon@ssb.no
tel.: (+47) 21 09 46 42


