Content
Published:
This is an archived release.
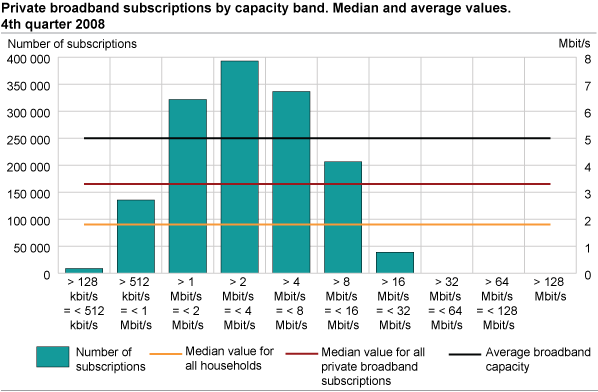
Normal broadband capacity at 3.3 Mbit/s
The normal broadband capacity for private subscriptions lies in the capacity band of 2-4 Mbit/s in the 4th quarter 2008. The average broadband capacity is 5.0 Mbit/s. The growth in fixed access continues at a lower rate.
The growth rate of high capacity access continues
From the 4t h quarter 2008 onwards, new bands of broadband capacity have been introduced in this survey. This change enables the calculation of the median and average values of broadband subscription capacity. Because the higher capacities are several times higher than the normal capacities, the average will be substantially higher than the median value. The median value has been calculated to be 3.3 Mbit/s and the average to 5.0 Mbit/s. These figures cover the private broadband subscriptions. If households without broadband subscriptions are included, the median and average values can be calculated to 1.8 and 3.5 Mbit/s respectively.
Twelve per cent of private broadband subscriptions have a download capacity higher than 8 Mbit/s. Only 4 per cent of business broadband subscriptions have such a high speed capacity. The number of low speed broadband subscriptions less than 512 kbit/s is less than 1 per cent in the private market and 7 per cent in the business market.
The private broadband subscription with a capacity of more than 8 Mbit/s is now 17 per cent. This is an increase from 12 per cent in the last quarter. Only 6 per cent of business broadband subscriptions have this capacity compared to 4 per cent in the last quarter.
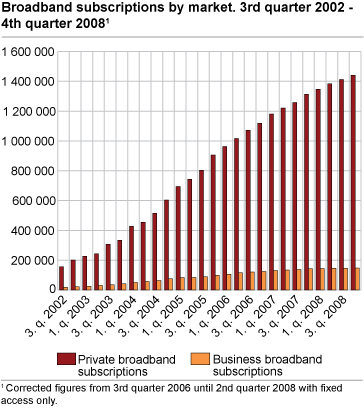
Reduced growth rate in number of broadband subscriptions
The number of broadband subscriptions with fixed access on the Norwegian mainland was 1 588 000 at the end of the 4th quarter of 2008; an increase of 9 per cent in the last twelve months. Two years ago there was an annual growth rate of 24 per cent and one year ago it was 17 per cent. At the end of the 4th quarter, Norway had 1 440 000 fixed private broadband subscriptions and 148 000 business subscriptions.
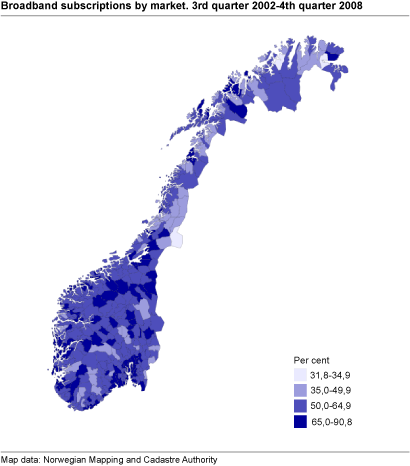
Continued growth in fixed household broadband subscriptions nationwide
The broadband penetration rate in private households is now 68.4 per cent. The figure for private broadband subscriptions per 100 households varies between 76 per cent in the county of Sør-Trøndelag and 57 per cent in the county of Finnmark.
| Centrality1 | Broadband subscriptions |
Broadband subscriptions
as a percentage of households |
|||||||||||||||||||||||||||||||||||||
|---|---|---|---|---|---|---|---|---|---|---|---|---|---|---|---|---|---|---|---|---|---|---|---|---|---|---|---|---|---|---|---|---|---|---|---|---|---|---|---|
| Remote municipalities | 115 211 | 59 | |||||||||||||||||||||||||||||||||||||
| Fairly remote municipalities | 80 008 | 64 | |||||||||||||||||||||||||||||||||||||
| Fairly central municipalities | 235 560 | 66 | |||||||||||||||||||||||||||||||||||||
| Central municipalities | 1 009 268 | 71 | |||||||||||||||||||||||||||||||||||||
| 1 | Centrality 2008, Municipalities 2008. |
The most central municipalities have the highest number of broadband subscriptions relative to the number of households. While the number of broadband subscriptions relative to the number of households is 71 per cent, the corresponding figure for less central municipalities is 59 per cent.
Only three municipalities have fewer than 35 private broadband subscriptions per 100 households. Four of the six municipalities with less than 35 per cent the previous quarter were among the seven with the largest increase in relative subscription rate this quarter.
| Municipalities |
Broadband subscriptions
as a percentage of households |
||||||||||||||||||||||||||||||||||||||
|---|---|---|---|---|---|---|---|---|---|---|---|---|---|---|---|---|---|---|---|---|---|---|---|---|---|---|---|---|---|---|---|---|---|---|---|---|---|---|---|
| Average for all municipalities | 68.4 | ||||||||||||||||||||||||||||||||||||||
| 0941 Bykle | 90.8 | ||||||||||||||||||||||||||||||||||||||
| 1121 Time | 89.2 | ||||||||||||||||||||||||||||||||||||||
| 0215 Frogn | 86.2 | ||||||||||||||||||||||||||||||||||||||
| 0544 øystre Slidre | 86.1 | ||||||||||||||||||||||||||||||||||||||
| 1151 Utsira | 85.6 | ||||||||||||||||||||||||||||||||||||||
| 0213 Ski | 85.1 | ||||||||||||||||||||||||||||||||||||||
| 1252 Modalen | 85.0 | ||||||||||||||||||||||||||||||||||||||
| 1018 Søgne | 83.8 | ||||||||||||||||||||||||||||||||||||||
| 1601 Trondheim | 83.2 | ||||||||||||||||||||||||||||||||||||||
| 0217 Oppegård | 82.7 | ||||||||||||||||||||||||||||||||||||||
| 0926 Lillesand | 81.1 | ||||||||||||||||||||||||||||||||||||||
| 1046 Sirdal | 79.4 | ||||||||||||||||||||||||||||||||||||||
| 0521 øyer | 79.1 | ||||||||||||||||||||||||||||||||||||||
| 1232 Eidfjord | 79.1 | ||||||||||||||||||||||||||||||||||||||
| 1563 Sunndal | 78.9 | ||||||||||||||||||||||||||||||||||||||
| 1245 Sund | 78.8 | ||||||||||||||||||||||||||||||||||||||
| 0228 Rælingen | 78.7 | ||||||||||||||||||||||||||||||||||||||
| 1122 Gjesdal | 78.4 | ||||||||||||||||||||||||||||||||||||||
| 1924 Målselv | 78.4 | ||||||||||||||||||||||||||||||||||||||
| 1246 Fjell | 78.3 | ||||||||||||||||||||||||||||||||||||||
| 1244 Austevoll | 78.2 | ||||||||||||||||||||||||||||||||||||||
| 1528 Sykkylven | 77.9 | ||||||||||||||||||||||||||||||||||||||
| 1222 Fitjar | 77.7 | ||||||||||||||||||||||||||||||||||||||
About calculation of median and averageMedian value is the value that divides the population in two equal parts - those with higher and those with lower values. In the calculation of the median value it is postulated that the subscriptions in the capacity band of 2-4 Mbit/s divide themselves evenly on all values in this group. In the calculation of averages it is postulated that the subscriptions divide themselves evenly also in all the other groups. |
|
The mobile broadband access was removed because this part of the statistics has not been complete and because these subscriptions cannot be distributed geographically and by download capacity in the same way as the fixed access subscriptions. The Norwegian Post and Telecommunications Authority also compiles statistics on these mobile subscriptions but without information about the geographical location or download capacity. The number of Internet service providers reporting to this survey has been around 200 the last two years. Market changes have reduced this number to 191 this quarter. A few small, but locally important Internet service providers, mostly cable TV providers, are still not included in the survey. Efforts have been made to include these providers. Some small errors related to the distribution of subscribers between municipalities may occur. This may have major consequences for the figures per household for some municipalities. Individuals and businesses may have several Internet subscriptions and several individuals may use the same subscription. The number of subscriptions is therefore not equivalent to the number of households/businesses with Internet access. A household can for instance get Internet access through an employer, educational institution or by sharing access with other households. The survey ICT in households provides more information about households with at least one member under the age of 75 with Internet access. For more information, see About the statistics . |
Tables:
- Table 1 Private broadband subscriptions. Subscription by transmission capacity and county including Svalbard. 4th quarter of 2008
- Table 2 Business broadband subscriptions. Subscription by transmission capacity and county including Svalbard. 4th quarter of 2008
- Table 3 Development features. Broadband subscription by market. Active subscriptions only. The whole country without Svalbard
- Table 4 Broadband subscriptions (larger than 128 kbit/s). Business and private subscriptions. 4th quarter 2008. Municipality
Contact
-
Statistics Norway's Information Centre
E-mail: informasjon@ssb.no
tel.: (+47) 21 09 46 42