Content
Published:
This is an archived release.
Only minor changes in innovation activity
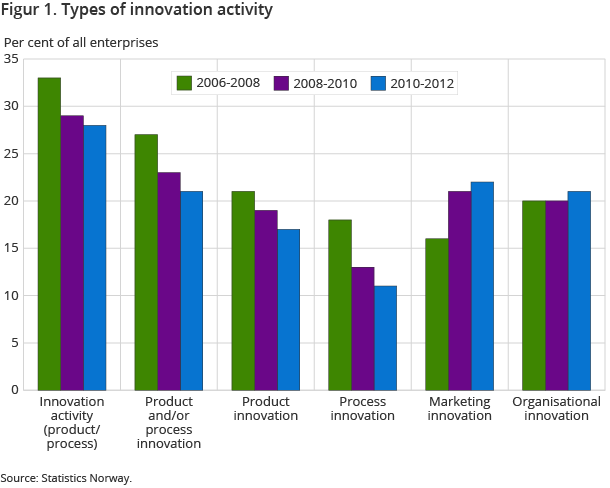
The overall level of innovation activity in Norwegian enterprises remained unchanged during the period from 2010 to 2012 compared to the previous survey. The share of enterprises with product or process innovation activity declined one per cent, while the shares of enterprises with organisational and marketing innovation both increased by the same amount.
| 2010 - 2012 | |||||
|---|---|---|---|---|---|
| Per cent of all enterprises 5+ persons employed | Per cent of enterprises 10+ | ||||
| Innovation activity (product/process) | Product Innovation | Process Innovation | Marketing Innovation | Organisational Innovation | |
| All industries | 28 | 16 | 11 | 22 | 21 |
| Manufacturing | 31 | 19 | 12 | 23 | 23 |
| Services | 30 | 19 | 12 | 25 | 21 |
| Other industries | 14 | 4 | 6 | 10 | 16 |
| Size of enterprise | |||||
| 5-9 persons employed | 28 | 17 | 12 | 25 | .. |
| 10-19 persons employed | 29 | 18 | 11 | 24 | 21 |
| 20-49 persons employed | 21 | 12 | 8 | 17 | 17 |
| 50-99 persons employed | 32 | 17 | 12 | 18 | 21 |
| 100-199 persons employed | 41 | 25 | 17 | 23 | 28 |
| 200-499 persons employed | 46 | 20 | 22 | 27 | 32 |
| 500 persons employed and more | 60 | 36 | 32 | 34 | 46 |


A total of 28 per cent of the enterprises introduced new or significantly improved products (goods or services) and/or processes (PP innovations) or had abandoned or ongoing activities with the aim of introducing such innovations (PP innovation activities) during the three-year period starting in 2010 and ending in 2012. Twenty-one per cent of the enterprises introduced organisational innovations, while 22 per cent introduced marketing innovations.
Continued decline for PP innovations
The share of enterprises who introduced PP innovations dropped from 23 to 21 per cent compared to the previous survey. Viewed in isolation, this decrease is within the margin of error, but it continues a downward trend that has also been observed in the previous two surveys. The share of enterprises that introduced new goods went from 14 to 12 per cent, new services from seven to six per cent, while the share of enterprises that introduced new processes was reduced from 13 to 11 per cent.
The decline in the share of PP innovators is primarily due to fewer enterprises without in-house research and development (R&D) reporting innovations. The number of enterprises with R&D who are also PP innovators is virtually the same as in the last survey. However, looking only at enterprises that participated in both surveys we see a decline in the number of innovators in both these groups. At the same time, there has been a marked increase in the number of R&D performers compared to the last survey. Thus, we might be observing a broader decline that is to some degree offset by more small and innovative enterprises reporting R&D in the present survey.
Stable trend for organisational and marketing innovation
The shares of enterprises with organisational and marketing innovation both increased by one percentage point compared to the previous survey. Organisational and marketing innovations are much more common amongst enterprises with PP innovation activity than those without, but both organisational and marketing innovations had an increase in both these groups; from 41 to 44 and 10 to 12 per cent for organisational innovation and from 44 to 49 and 11 to 12 per cent for marketing innovation.
In the longer term, the trend for organisational innovations is more or less flat over the past three surveys. Marketing innovations on the other hand appear to show a rising trend. However, this result is due to a simpler phrasing of this question being given to enterprises with 5-9 employees in the 2006-2008 survey, which significantly reduced the reported incidence of marketing innovations in this group. Correcting for this skew, the trend for marketing innovations is more or less flat as well.
More enterprises collaborate with their competitors
The results from the survey also show an increase of two percentage points in the share of PP innovation active enterprises that have cooperated with others for the purpose of innovation development; from 28 per cent in 2008-2010 to 30 per cent in 2010-2012. However, the number of enterprises with innovation cooperation is essentially unchanged. The relative increase in the share of cooperating enterprises is, therefore, mainly due to a drop in the number of enterprises with PP innovation activity from the previous survey.
We also observe an increase in the average number of different cooperation partners reported amongst the enterprises that do cooperate; a trend that is continued from the previous survey. This presents as an increase in the share of PP innovation active enterprises reporting cooperation with each partner, except for cooperation with Suppliers. Nevertheless, supplier cooperation is the second most frequent form of cooperation, and is reported by 57 per cent of the cooperating enterprises. The most common cooperation is with Clients or customers in the private sector, with 59 per cent. For the second time in a row, cooperation with Competitors grew significantly and also had the largest increase since the last survey; up nine percentage points, from 21 to 30 per cent of enterprises with innovation cooperation.
Few public sector procurement contracts demand innovation
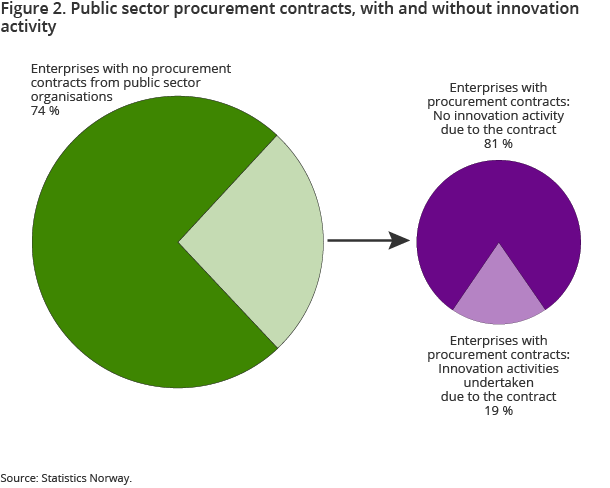
For the first time, the present survey also included a question seeking to map out whether the enterprises had procurement contracts from public sector organisations to deliver goods or services and to what degree these contracts required or led the enterprise to engage in innovation activities. Twenty-six per cent of the enterprises had such contracts with the Norwegian public sector, while three per cent reported contracts with foreign public sector institutions. Among the latter, the vast majority also had contracts with the Norwegian public sector.
Having public sector procurement contracts resulted in innovation activity for 19 per cent of the enterprises with such contracts. Eight per cent reported having at least one contract where innovation was required as an integral part of the contract. The remaining 11 per cent had contracts that did not require innovation, but nevertheless resulted in the enterprise engaging in innovation activities as part of fulfilling the contract.
Sample survey brings statistical uncertainty to the resultsOpen and readClose
The survey covers the entire manufacturing sector and large parts of the services sector, along with other selected industries. The survey is in the form of a representative sample survey of enterprises with between 5 and 49 employees, with the addition of complete coverage of enterprises with more than 50 employees.
Due to the CIS being in part a sample survey, there is an inherent statistical uncertainty to the results. The uncertainty attached to the size groups containing the smaller enterprises is greater than for the larger enterprises. Comparisons over time for the detailed industry breakdowns should also be made with some caution, especially for industries with relatively few enterprises in the population.
Contact
-
Lars Wilhelmsen
E-mail: lars.wilhelmsen@ssb.no
tel.: (+47) 40 90 24 35
