Content
Published:
This is an archived release.
Relative stability for quantitative innovation indicators
The share of turnover originating from new or significantly improved products was slightly lower in 2012 compared to the previous survey. Turnover from products that were new to the enterprises’ markets remained higher than turnover from products that were only new to the enterprises.
| 2010-2012 | ||||
|---|---|---|---|---|
| Per cent of all enterprises 5+ persons employed | Per cent of product innovators’ turnover | 1000 NOK | ||
| Innovation activity (product/process) | Product innovation | Turnover from product innovations | Total innovation expenditures | |
| All industries | 28 | 16 | 13.7 | 34 447 844 |
| Manufacturing | 31 | 19 | 25.3 | 13 254 437 |
| Services | 30 | 19 | 20.6 | 15 294 076 |
| Other industries | 14 | 4 | 3.5 | 5 899 331 |
| Size of enterprise | ||||
| 5-9 persons employed | 28 | 17 | 36.8 | . |
| 10-19 persons employed | 29 | 18 | 31.4 | 3 448 041 |
| 20-49 persons employed | 21 | 12 | 21.9 | 4 712 128 |
| 50-99 persons employed | 32 | 17 | 26.1 | 4 056 100 |
| 100-199 persons employed | 41 | 25 | 27.4 | 4 897 547 |
| 200-499 persons employed | 46 | 20 | 20.9 | 3 759 847 |
| 500 persons employed and more | 60 | 36 | 9.2 | 13 574 182 |


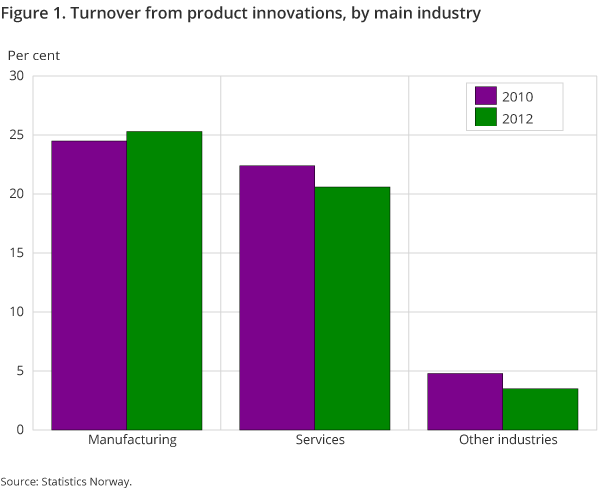
13.7 per cent of the product innovators’ turnover in 2012 stemmed from new or significantly improved products in the form of goods or services (product innovations) that were introduced to the market during the three year period from 2010 to 2012. This is a slight decrease from 15.5 per cent in 2010 for innovations introduced between 2008 and 2010. The share of enterprises that introduced product innovations during the respective periods declined from 19 to 16 per cent.
Significant variation between industries
The manufacturing industries saw an increase in the share of turnover that stemmed from product innovations, while both services industries and “other industries” experienced a decline. The share of turnover from new products can vary significantly, even within these groups and between different size classes, but when we consider only these three main industry groupings it is the “other industries” group that stands out.
Product innovations are responsible for almost a quarter of the innovators’ turnover in the manufacturing industries and not much less than that in the services sector. This is in contrast to the enterprises in other industries where only a very small share of turnover stems from innovations. A shared characteristic between many industries in the latter group is that many of them deal in unprocessed goods or raw materials. This is the case for fishing and aquaculture, mining and quarrying, extraction of oil and gas, as well as the production and sale of refined petroleum products. When it comes to maintaining or increasing their turnover, these industries tend to be more dependent on global commodities’ pricing or on extraction rates than they are on renewing their product portfolios through innovation. Especially in the industries relating to oil and gas the overall turnover is also very high, so even a reasonably large contribution from a new or improved product may not make much of an impact relative to the total.
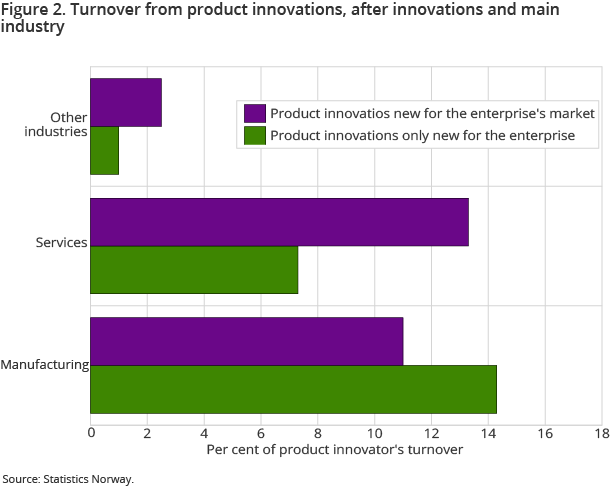
Overall, it was product innovations that were new to the enterprises’ markets that had the greatest impact on turnover, with a total of 7.6 per cent. Product innovations that were only new to the enterprises accounted for 6.1 per cent. Product innovations that were new to the market were the most important in the services industries, while the manufacturing industries depended more on innovations that were only new to the enterprises.
Nominal increase in innovation expenditure
The enterprises’ overall innovation expenditure for developing new products or processes rose from NOK 29 billion in 2010 to NOK 34.5 billion in 2012. Both expenditures for In-house R&D and for External R&D were significantly higher than in 2010, with increases of NOK 3.5 billion and 700 million respectively, while Acquisition of machinery, equipment and software increased by roughly NOK 1 billion. Other expenditure, a category that includes Training for innovative activities, Market introduction of innovations and Design, as well as other non-specified costs, rose by NOK 390 million. Only expenditure for the Acquisition of external knowledge decreased somewhat, dropping slightly less than NOK 100 million.
Overall, R&D costs – both internal and external – still dominate the reporting, and the share of innovation expenditure not classified as R&D remained virtually unchanged at 21.6 per cent compared to 21.3 per cent in the previous survey.
Analysing innovation intensity
One possible way to look at innovation intensity is to consider the total innovation expenditure as a share of turnover for enterprises that have either introduced innovations or undertaken activities for developing new products or processes. Industries with a strong innovation intensity will show a high share of costs relative to turnover, while the corresponding share for low intensity industries will approach zero. This is a similar principle to making international comparisons of R&D intensity by measuring R&D expenditure relative to GDP.
The innovation intensity varies significantly between the individual industries, but these numbers may to some degree be influenced by relatively large one-time investments. However, it is interesting to note that across all the three main industry groups it is the smaller enterprises, with less than 50 employees, that invest the largest share of their turnover in innovation. Overall, it is the manufacturing industries that have the most innovation-intense innovators, with 3 per cent of turnover, while the service industry innovators spent 2.6 per cent. Again, the group consisting of other industries is by far the lowest at 0.6 per cent. For all enterprises together, the ratio of innovation intensity amongst the innovators is practically unchanged since the last survey, up from 1.7 to 1.8 per cent.
High costs, limited financing and uncertain demand inhibit innovation activities
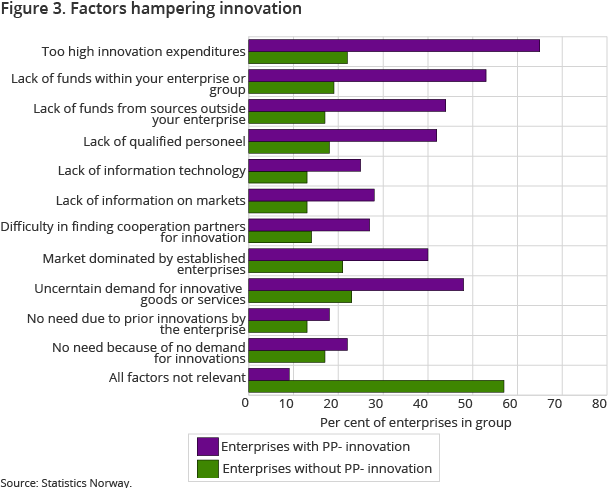
In connection with what enterprises regard to be very or somewhat important to hampering their innovation effort or preventing them from being innovative, there are relatively large disparities between enterprises that reported any innovation activities for developing new products or processes and enterprises that did not. As in the last survey, it was primarily monetary factors that impacted the enterprises that either innovated or had innovation activities. Too high innovation costs and a lack of funds within the enterprise or group were the most common factors, with 65 and 53 per cent respectively. This was followed by an uncertain demand for innovative goods or services, which was reported by 48 per cent of the innovation active enterprises.
Among enterprises that neither introduced innovations nor had any activities for developing new products or processes during the period, it was the uncertain demand for innovative goods or services that most commonly prevented them from being innovative. This was reported by 23 per cent of the enterprises in this group. Too high innovation costs and the market being dominated by established enterprises were both reported by slightly more than 20 per cent of the non-innovators. However, the most notable result here is that as many as 57 per cent of the non-innovating enterprises said that none of the listed factors were relevant for them not being innovative or trying to be innovative. For the enterprises that did have innovation activity, only 9 per cent reported all factors to be irrelevant. This may indicate that non-innovating enterprises to a large degree do not reflect on why they are not innovating, or possibly that they find the survey itself to be irrelevant to how they view their activities.
Sample survey brings statistical uncertainty to the resultsOpen and readClose
The survey covers the entire manufacturing sector and large parts of the services sector, along with other selected industries. The survey is in the form of a representative sample survey of enterprises with between 5 and 49 employees, with the addition of complete coverage of enterprises with more than 50 employees.
Due to the CIS being in part a sample survey, there is an inherent statistical uncertainty to the results. The uncertainty attached to the size groups containing the smaller enterprises is greater than for the larger enterprises. Comparisons over time for the detailed industry breakdowns should also be made with some caution, especially for industries with relatively few enterprises in the population.
Contact
-
Lars Wilhelmsen
E-mail: lars.wilhelmsen@ssb.no
tel.: (+47) 40 90 24 35
