Content
Published:
This is an archived release.
Norwegian applications stable in recent years
The number of national patent applications from Norwegian applicants has remained fairly stable since Norway joined the European Patent Office (EPO) in 2008. In 2014, the Norwegian Patent Office received 1 570 patent applications. This is 10 per cent less than the year before, but at the same level as in 2012.
| 2014 | 2010 - 2014 | ||
|---|---|---|---|
| Total number of applications | Of which: Filed by Norwegian applicants. Percentage share | Total number of applications. Percentage change | |
| Patents | 1 570 | 67.3 | -13.4 |
| Design | 1 218 | 24.7 | 53.4 |
| Trade marks | 15 476 | 26.0 | 13.0 |
Intellectual property rights are often used as an indicator for creativity and as an output indicator for R&D and innovation, in particular for patents. However, there are a number of reservations about using such rights as output indicators in this field.
Fewer international patent applications are forwarded
The decline in applications from 2013 to 2014 is due to a decline in forwarded international patent applications via the PCT system. The number of Norwegian applicants is more or less at the same level. Around three quarters of the Norwegian applications are received from enterprises. As expected, the Norwegian membership in EPO has caused a strong decline in the number of international patent applications forwarded to the Norwegian Patent Office.
The number of applications for design was 1 218 in 2014, and is thus lower than the number of patent applications. Predominantly, this applies to applications from Norwegian entities. Overall, there has been a slight increase in the number of design applications in recent years, but applications from international actors constitute a significantly higher share than is the case for patents.
Number of trademark applications varies from year to year
The number of applications for registration of trademarks is much higher than for either registered designs or patents, with a total of 15 500 in 2014. The number of trademark applications has increased from 2010, but the development from year to year has varied significantly. The distribution between Norwegian and foreign applicants has also varied during the same timeframe.
Most patent applications in construction and thermodynamics
The number of granted patents and patent applications can be aggregated by different classifications. The international classification, IPC, which is used by the patent authorities when processing the applications, is based on the technical characteristics of inventions. The majority of applications are in construction and thermodynamic techniques, where the majority of these applications are related to the extraction of oil and gas. However, the IPC system does not give unique information on the applicant’s industrial activity.
The probability of patenting varies across industries
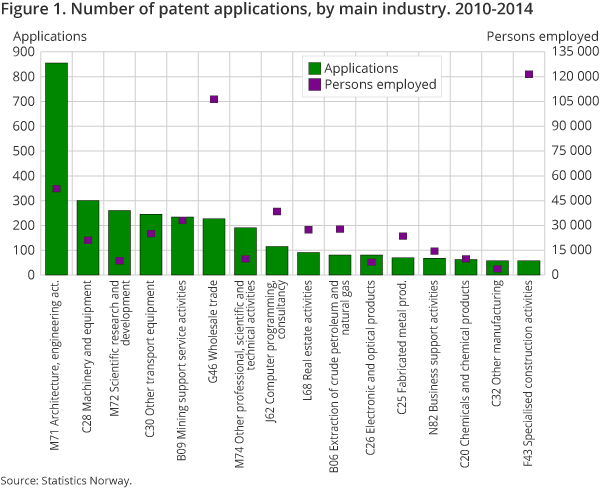
Patenting is unevenly distributed in the business enterprise sector and highly skewed by type of industry. Norwegian patent applications for the period 1990-2014 have been linked to other data sources with information on the applicant’s industry classification and employment. These data show that the likelihood of an enterprise applying for a patent is quite high in some industries, while patent activity is totally absent in others. In absolute terms, patenting is clearly highest in engineering. Other industries with patent activity are located in both manufacturing and services. Figure 1 shows the industries with the highest number of patent applications during the 5-year period 2010-2014.
Trade services and the manufacture of food products apply for trademark protection
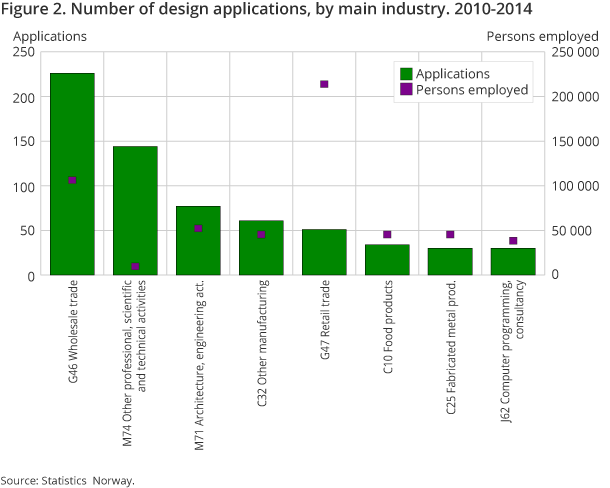
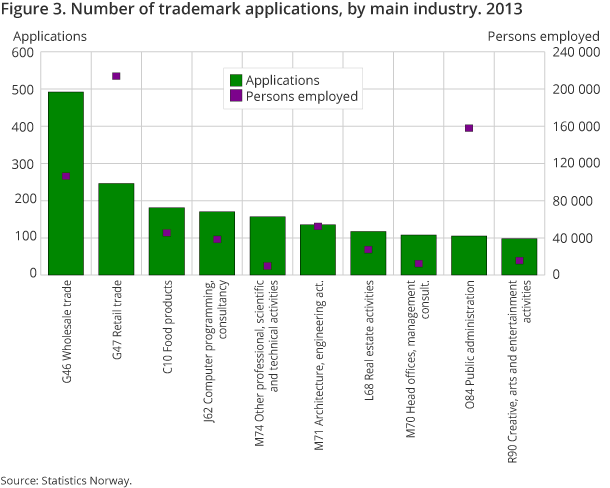
The structure of industries applying for patents, design and trademarks respectively is different. However, there is a tendency for trademarks and designs to overlap. Both types of protection are most common in wholesale trade, but are also popular in retail trade. In addition, both trademark and patent protection are often applied for in other professional, scientific and technical activities. The manufacture of food products has a fairly large number of trademark applications; the same is true for computer programming and consultancy. Design protection is applied both in trade, technical services and other industries.
Patent applications are most common among large enterprises
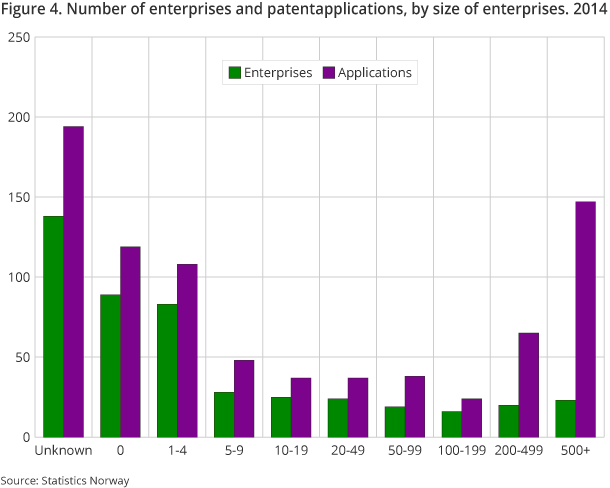
Applications can also be broken down by the size of enterprises. For patent applications, the distribution partly shows a U shape: Patents are mainly applied for by very small enterprises, with less than 10 persons employed, or large enterprises, with more than 200 persons employed. Enterprises lacking information about the number of persons employed are normally small enterprises. Compared to the total number of enterprises, there is a higher share of large enterprises applying for patents. Figure 4 also shows that the number of applications per large enterprise is higher than for small enterprises on average.
Large enterprises are less dominating in design
Large enterprises are less dominating in applications for design and trademarks. The number of trademark applications per large enterprise is smaller, and considerably so for design applications than for patent applications. The share of design applications submitted by very large enterprises is only 5 per cent. Similarly, for trademarks the figure is 13 per cent.
The USA has a large share of European applications
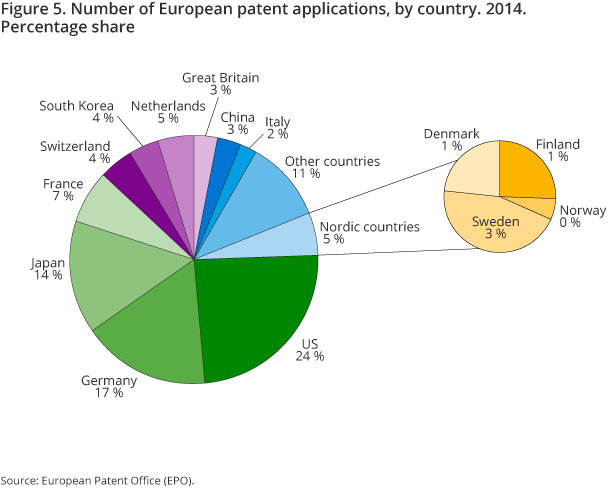
Direct European patent applications via the EPO and applications from other countries for the European market have increased slightly in each of the last four years, and the total number of applications in 2014 exceeded the prior peak year of 2010.
In terms of patenting, the USA is by far the largest country in the European market, with a share of 24 per cent of all applications. Japan also has a high share, with 15 per cent. China is the country with the largest growth in patent applications: more than doubling since 2010. South Korea has even more applications than China, but their growth is weaker. Among the European countries, Germany dominates with 17 per cent of all applications. The patenting figures in Nordic countries are quite moderate: Sweden is leading with a share of 2.5 per cent of the European market. Norway has far fewer patent applications than Sweden, Finland and Denmark.
Contact
-
Claudia Berrios
E-mail: claudia.berrios@ssb.no
tel.: (+47) 40 90 24 51
