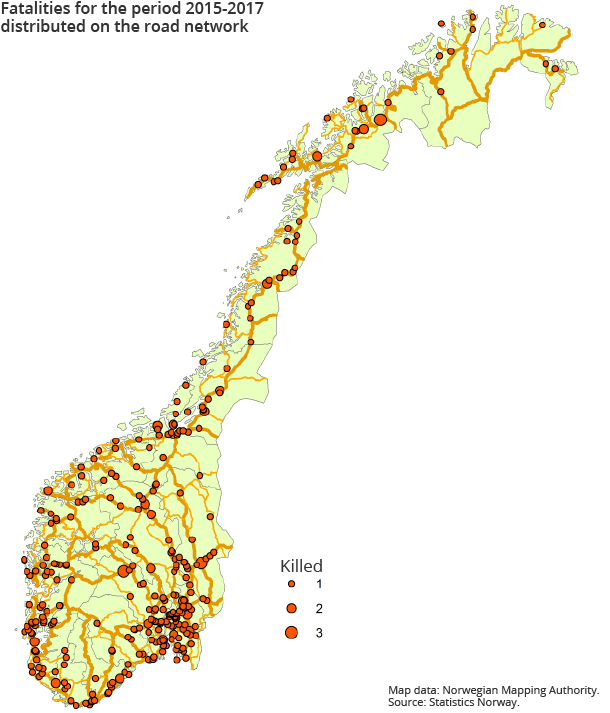
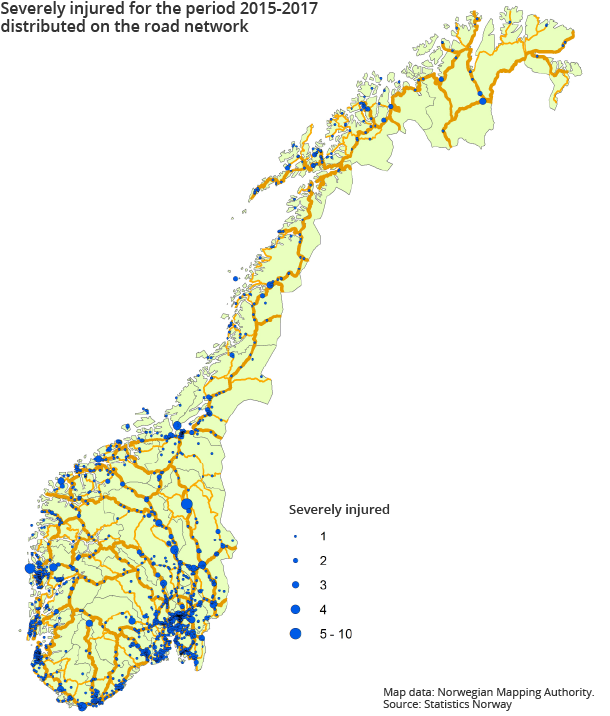
106 killed, 665 severely injured
Published:
Updated:
In 2017, 106 people died in 102 fatal accidents on Norwegian roads, and 665 people were severely injured. This was 29 less fatalities than in 2016, while the number of severely injured increased by 9.
- Full set of figures
- Road traffic accidents involving personal injury
- Series archive
- Road traffic accidents involving personal injury (archive)
These figures are the lowest since 1947, when there were 94 fatalities and 640 people were severely injured. In the other Nordic countries, we find a similar positive trend. In Sweden, 253 were killed in traffic last year compared to 270 in 2016. In Denmark, there were 183 fatalities last year compared to 211 in 2016 according to preliminary figures. Similarly, in Finland the number was reduced from 258 to 212 in 2017.
The number with minor injuries amounted to 4 246 in 2017, about 370 less than the previous year.
Figure 1. Road traffic accidents. Persons killed or slightly injured, by degree of injury. 2005-2017. 2005=100
| 2005 | 2006 | 2007 | 2008 | 2009 | 2010 | 2011 | 2012 | 2013 | 2014 | 2015 | 2016 | 2017 | |
| Killed | 100.00 | 108.04 | 104.02 | 113.84 | 94.64 | 92.86 | 75.00 | 64.73 | 83.48 | 65.63 | 52.23 | 60.27 | 47.32 |
| Severely injured | 100.00 | 96.21 | 89.97 | 88.74 | 76.87 | 73.08 | 69.50 | 71.55 | 71.95 | 68.99 | 70.93 | 67.14 | 68.27 |
| Slightly injured | 100.00 | 93.77 | 93.53 | 93.14 | 82.39 | 77.41 | 74.13 | 71.00 | 60.85 | 57.08 | 51.09 | 48.79 | 44.91 |
25 000 fatalities on EU roads
The European Commission has recently released preliminary figures showing that 25 300 persons were killed in road traffic accidents in EU countries in 2017, only 300 less than in 2016. This correspond to 4.9 fatalities per 100 000 inhabitants. In Norway, the exposure risk was only 2.0 deaths per 100 000 inhabitants.
Figure 2. Road traffic accidents. Persons killed in the Nordic countries per 100 000 of the population. 2004-2017
| 2004 | 2005 | 2006 | 2007 | 2008 | 2009 | 2010 | 2011 | 2012 | 2013 | 2014 | 2015 | 2016 | 2017* | |
| Denmark | 6.8 | 6.1 | 5.6 | 7.5 | 7.4 | 5.5 | 4.6 | 3.9 | 3.0 | 3.4 | 3.2 | 3.1 | 3.7 | 3.2 |
| Finland | 7.2 | 7.2 | 6.4 | 7.2 | 6.5 | 5.2 | 5.1 | 5.4 | 4.7 | 4.7 | 4.1 | 4.9 | 4.4 | 3.9 |
| Norge | 5.6 | 4.9 | 5.2 | 5.0 | 5.4 | 4.4 | 4.2 | 3.4 | 2.9 | 3.7 | 2.9 | 2.2 | 2.6 | 2.0 |
| Sweden | 5.3 | 4.9 | 4.9 | 5.2 | 4.3 | 3.9 | 2.8 | 3.4 | 3.0 | 2.7 | 2.8 | 2.6 | 2.7 | 2.5 |
16 and 17-year-olds at risk
If we look at the numbers killed and severely injured in traffic in one-year age groups, we see that the risk is by far the highest for 16-year-olds, with 43 killed and severely injured per 100 000 inhabitants. The 17-year-olds also have a high risk at 34.9.
Figure 3. Persons killed and seriously injured by age per 100 000 inhabitants. 2017
| Persons killed or seriously injured per 100000 inhabitants | |
| 0 year | 0.0 |
| 1 year | 1.7 |
| 2 year | 0.0 |
| 3 year | 1.6 |
| 4 year | 0.0 |
| 5 year | 6.3 |
| 6 year | 1.6 |
| 7 year | 1.5 |
| 8 year | 1.5 |
| 9 year | 4.6 |
| 10 year | 4.7 |
| 11 year | 3.1 |
| 12 year | 1.6 |
| 13 year | 6.4 |
| 14 year | 8.0 |
| 15 year | 8.1 |
| 16 year | 43.0 |
| 17 year | 34.9 |
| 18 year | 24.1 |
| 19 year | 13.7 |
| 20 year | 11.9 |
| 21 year | 17.5 |
| 22 year | 27.8 |
| 23 year | 20.4 |
| 24 year | 17.2 |
| 25 year | 11.1 |
| 26 year | 20.3 |
| 27 year | 14.6 |
| 28 year | 15.9 |
| 29 year | 12.0 |
| 30 year | 15.1 |
| 31 year | 12.4 |
| 32 year | 5.6 |
| 33 year | 11.3 |
| 34 year | 12.8 |
| 35 year | 14.0 |
| 36 year | 12.9 |
| 37 year | 18.4 |
| 38 year | 20.1 |
| 39 year | 13.0 |
| 40 year | 5.9 |
| 41 year | 14.5 |
| 42 year | 14.1 |
| 43 year | 9.5 |
| 44 year | 24.4 |
| 45 year | 17.1 |
| 46 year | 26.2 |
| 47 year | 19.9 |
| 48 year | 16.9 |
| 49 year | 13.1 |
| 50 year | 20.3 |
| 51 year | 13.6 |
| 52 year | 15.2 |
| 53 year | 21.2 |
| 54 year | 17.7 |
| 55 year | 16.6 |
| 56 year | 18.5 |
| 57 year | 15.6 |
| 58 year | 14.1 |
| 59 year | 22.2 |
| 60 year | 13.0 |
| 61 year | 17.7 |
| 62 year | 16.6 |
| 63 year | 15.3 |
| 64 year | 19.1 |
| 65 year | 12.4 |
| 66 year | 5.6 |
| 67 year | 14.8 |
| 68 year | 16.7 |
| 69 year | 18.5 |
| 70 year | 9.1 |
| 71 year | 3.6 |
| 72 year | 24.5 |
| 73 year | 21.6 |
| 74 year | 22.3 |
| 75 year | 21.9 |
| 76 year | 25.8 |
| 77 year | 22.4 |
| 78 year | 17.0 |
| 79 year | 29.4 |
| 80 year | 32.2 |
| 81 year | 35.0 |
| 82 year | 28.9 |
| 83 year | 36.2 |
| 84 year | 16.7 |
| 85 year | 22.6 |
| 86 year | 31.1 |
| 87 year | 20.4 |
| 88 year | 23.9 |
| 89 year | 17.8 |
| 90 year | 0.0 |
| 91 year | 12.0 |
| 92 year | 0.0 |
Most fatalities are drivers or car passengers
More than half of the 106 persons killed in traffic last year were either drivers (51) or car passengers (12). The number of motorcyclists killed remained stable; 20 in 2017, 22 in 2016 and 20 in 2015 and 2014 respectively. The number of cyclists killed fell from 12 to 9, while the number of pedestrians dropped from 15 in 2016 to 11 last year.
More head-on collisions
In 2017, 29 persons were killed in accidents involving one vehicle, corresponding to 27 per cent of all traffic fatalities. A total of 48 persons were killed in head-on collisions; a share of 45 per cent. In 2016, head-on collisions accounted for 31 per cent of all traffic fatalities and the share for one-vehicle accident was 40.7 per cent. Accidents involving pedestrians constituted 10 per cent of the fatalities.
Figure 4. Road traffic accidents. Persons injured and killed, by type of accident. Per cent. 2017
| Accidents. Total | Injured and killed | Fatal accidents | Killed | |
| Other group of accidents | 43.1 | 44.0 | 17.6 | 17.0 |
| Single vehicles running off the road | 33.9 | 30.1 | 28.4 | 27.4 |
| Head-on accidents | 13.7 | 18.4 | 43.1 | 45.3 |
| Accidents involving pedestrian | 9.3 | 7.6 | 10.8 | 10.4 |
Most fatalities outside urban areas
Most fatal accidents happen outside urban areas. Of the106 who were killed in traffic in 2017, 84 lost their lives outside urban areas.
Figure 5. Road traffic accidetns. Accidents by area of residence. 2017
| In densely populate area | Outside densely populated area | |
| Drepte | 21 | 80 |
| Antall dødsulykker | 21 | 84 |
111 heavy vehicles involved in road traffic accidents
Thirteen people were killed in accidents involving heavy vehicles, compared to 15 in 2016. A total of 111 heavy vehicles were involved in a personal injury accident, compared to 137 in 2016.
Ingress has been changed: 29.05.2018.
Contact
-
Asbjørn Willy Wethal
-
Elin Hellerud
-
Bente Elisabeth Andresen
-
Statistics Norway's Information Centre


