Increased national freight transport
Published:
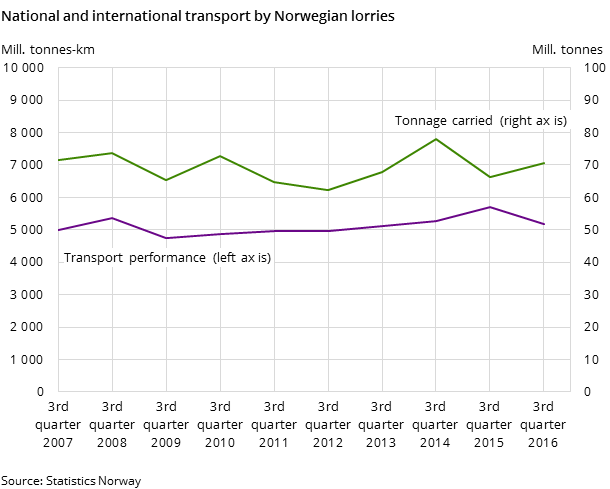
Norwegian lorries carried 70.8 million tonnes of goods in the 3rd quarter of 2016; 6.8 per cent more than in the same quarter in 2015.
- Full set of figures
- Road goods transport by Norwegian lorries
- Series archive
- Road goods transport by Norwegian lorries (archive)
However, even though more freight was transported, transport performance decreased by 9.1 per cent and ended at 5.2 billion tonne kilometres. Transport performance carried out domestically by Norwegian lorries in the 3rd quarter of 2016 amounted to 4.6 billion tonne kilometres; 9.6 per cent less than in the 3rd quarter of 2015. Lorries transported 69.6 million tonnes of goods. This is 7.1 per cent more than in the corresponding quarter of the previous year. The transport performance internationally decreased by 5.4 per cent and by 8.9 per cent of the tonnage.
- See more figures and tables in the statistics Road goods transport by Norwegian lorries
361 million kilometres with load
Norwegian lorries drove a total of 25.6 million kilometres less than in the 3rd quarter of 2015. Of the 506 million kilometres driven, 361 million kilometres were driven with goods. This resulted in an empty driving rate of 28.5 per cent. This was 3.8 percentage points more than in the corresponding quarter in 2015. On domestic journeys, Norwegian-registered lorries drove 332 million kilometres with goods; 40 million kilometres less than in the same quarter in 2015.
Figure 2. National transports. Vehicle kilometres by Norwegian lorries
| Unloaded vehicle-kilometres | Vehicle kilometres with load | |
| 3rd quarter 2007 | 108.9 | 306.3 |
| 3rd quarter 2008 | 119.7 | 351.6 |
| 3rd quarter 2009 | 118.5 | 309.6 |
| 3rd quarter 2010 | 120.9 | 338.0 |
| 3rd quarter 2011 | 105.6 | 334.5 |
| 3rd quarter 2012 | 127.4 | 322.8 |
| 3rd quarter 2013 | 121.5 | 355.8 |
| 3rd quarter 2014 | 134.7 | 358.4 |
| 3rd quarter 2015 | 121.3 | 371.7 |
| 3rd quarter 2016 | 134.5 | 332.0 |
Reduced average mileage per tonne
Average mileage per tonne for national trips was down from 78 to 66 kilometres per tonne, compared to the 3rd quarter of 2015. International trips increased from 500 to 519 kilometres per tonne.
Mass transport dominates
Norwegian lorries transported almost 43 million tonnes of gravel, sand, soil etc. on Norwegian roads in the 3rd quarter of 2016. Mass transport increased by 10.4 per cent of the total transport volume in the 3rd quarter of 2016. Since mass transport is carried out over shorter distances, the transport of gravel, sand, soil etc. accounts for only 29.2 per cent of the total transport performance. The transport of Other manufactured goods, grouped goods and other group dominates because they are transported farther.
Figure 3. National transport tonnage carried by commodity. 3rd quarter 2016
| Transportmengde (mill. tonn) | |
| Agricultural products, forestry products, fishing products 7.2% | 5.0 |
| Food products, beverages, tobaco and animal fodder 6.6% | 4.6 |
| Coal, oil and chemicals and chemical products (incl. fertilizer) 12.1% | 8.4 |
| Metal ores, stone, sand, gravel, clay, salt, cement, lime, manufactured construction materials 60.7% | 42.3 |
| Other manufactured goods, grouped goods and other goods 13.2% | 9.4 |
Figure 4. National transport performance by commodity. 3rd quarter 2016
| Transportarbeid (mill. tonnkm) | |
| Agricultural products, forestry products, fishing Products 13.7 % | 630 |
| Food products, beverages, tobaco and animal fodder 19.2 % | 885 |
| Coal, oil and chemicals and chemical products (incl. fertilizer)11.6 % | 536 |
| Metal ores, stone, sand, gravel, clay, salt, cement, lime, manufactured construction materials 29.2 % | 1345 |
| Other manufactured goods, grouped goods and other goods 26.3 % | 1209 |
Contact
-
Nataliya Granerud
-
Statistics Norway's Information Centre

