Content
Published:
This is an archived release.
Sharp drop in freights
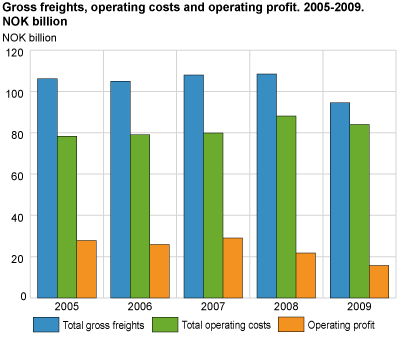
Freight income from ocean transport went below NOK 100 billion in 2009 for the first time in five years. At NOK 99.7 billion freights were 9 per cent lower than in 2008.
Figures for ocean transport comes from enterprises within the industry sub classes of Passenger ocean transport, Freight ocean transport, Tugs, and Supply and other sea transport offshore services.
Liner freights down
Freight income from liner trade fell 35 per cent from 2008 to 2009. Liner income at NOK 13.2 billion is NOK 7.4 billion less than in 2008. Voyage freights and contracts of affreightment also fell. For these freight types figures for 2009 was NOK 2.9, and NOK 3.7 billion below 2008.
Tankers earn the same
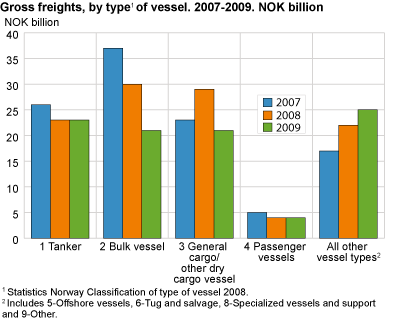
While freight income for bulk and dry cargo vessels mirrors the reduction in liner trade the situation is different for tankers. Tankers earned NOK 22.9 billion in 2009, unchanged from 2008.
Less purchase of time charter
Costs from renting manned foreign vessels were at NOK 11.3 billion in 2009. This is NOK 6.7 billion less than in 2008. The same figure for manned Norwegian vessels fell with 38 per cent in the same period. Bareboat rentals increased, however, by NOK 2.8 billion.
Growth in income from coastal traffic
Growth in turnover at enterprises within coastal water traffic stems mainly from increased income from passenger boats and car ferries. Domestic freight transport fell, however, by NOK 100 million from 2008 to 2009.
New data in 2009Starting in 2009, figures on Gross wage and social benefits to crew members include personnel contracted through crewing companies. For more information, see About the statistics . |
Tables:
Contact
-
Tom Jonas Billit
E-mail: tom.billit@ssb.no
tel.: (+47) 40 81 13 45
-
Mikael Sandberg
E-mail: mikael.sandberg@ssb.no
tel.: (+47) 40 81 14 99


