Content
Published:
This is an archived release.
Modest growth in food and beverage service activities
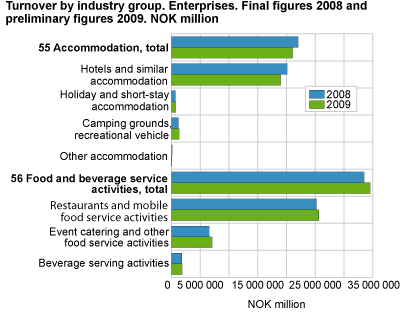
The enterprises in food and beverage service activities had a turnover of NOK 34.5 billion in 2009. This is an increase of 3 per cent from the previous year.
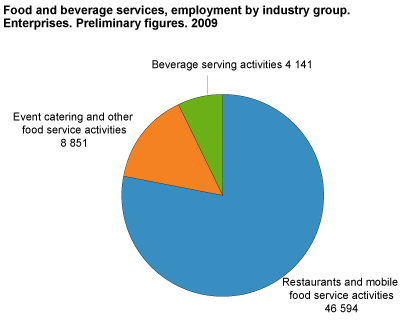
Employment in food and beverage service activities decreased by 2.1 per cent to 59 586 persons in 2009.
A total of 2 811 enterprises in accommodation services had a turnover of NOK 21 billion in 2009. This was 4.4 per cent less than the year before. Employment fell by 3.3 per cent to 26 409 persons.
Downturn for hotels
The enterprises in hotel and similar accommodation decreased their turnover by 5.6 per cent to NOK 19 billion in 2009. This is in accordance with Statistics Norway’s accommodation statistics showing a 3 per cent decline of guest nights over the same period.
Higher turnover, but fewer employees in restaurants
Restaurants dominate the food and beverage industry, and showed a weak growth in turnover by 1.7 per cent to NOK 25.6 billion in 2009. Employment however decreased by 3.1 per cent over the same period.
Preliminary figuresPreliminary figures for structural business statistics are only published on enterprise level. In general, the figures for enterprises will show other values than the figures for local kind-of-activity units. This is due to the fact that an enterprise registered with its main activity in one industry may have local kind-of-activity units in other industries. Only figures for number of enterprises, persons employed and turnover on a 3-digit industry level are published. The data are not as thoroughly revised as they will be when the final figures are published in May 2011. |
Tables:
The statistics is now published as Business statistics.
Contact
-
Statistics Norway's Information Centre
E-mail: informasjon@ssb.no
tel.: (+47) 21 09 46 42


