Content
Published:
This is an archived release.
Record high operating income for passenger transport
Operating income for passenger transport industries within land, sea and air transport increased by over 11 per cent from 2012 to 2013 and ended at nearly NOK 83 billion.
| 2013 | Change in per cent | ||
|---|---|---|---|
| 2012 - 2013 | 2009 - 2013 | ||
| 1Except for 49.5 Transport via pipelines | |||
| 2Except for 52.215 Services connected to transport via pipelines as of reference year 2010 | |||
| 3Operating income without spesial taxes and profits from the sales of fixed assets. Exclusive of VAT. | |||
| 4At factor costs | |||
| 5Change in the method influences personnel costs in subclasses 50.101, 50.201 and 50.204 | |||
| Enterprises | |||
| Enterprises (number) | 21 546 | -0.3 | -1.3 |
| Employment (number) | 153 028 | 0.6 | 0.6 |
| Turnover (NOK million)3 | 361 972.1 | 6.0 | 25.9 |
| Value added (NOK million)4 | 144 469.4 | 15.5 | 37.4 |
| Gross operating surplus (NOK million) | 60 861.8 | 11.9 | 42.6 |
| Local KAUs | |||
| GroLocal KAUs (number) | 22 402 | 0.0 | -0.9 |
| Employment (number) | 152 842 | 0.6 | 0.7 |
| Turnover (NOK million)3 | 361 170.2 | 5.9 | 25.9 |
| Personnel costs (NOK million)5 | 83 504.0 | 18.3 | 33.9 |
| Gross investments (NOK million) | 13 406.9 | -50.4 | -61.2 |


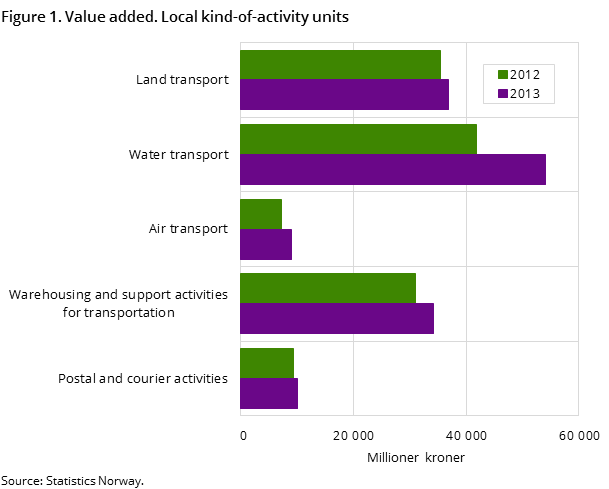
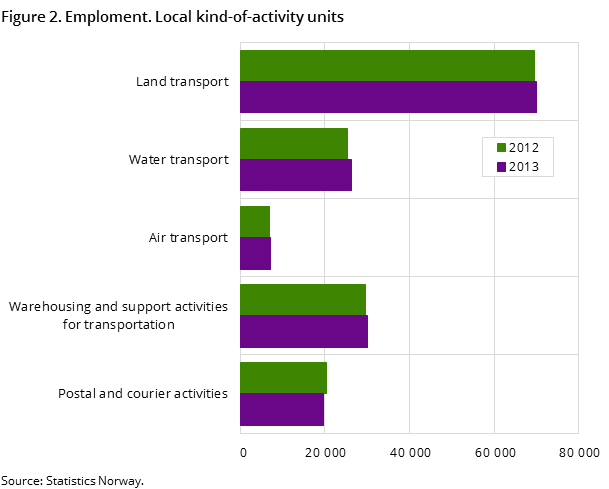
The industry group for ‘passenger air transport’ had the greatest percentage growth in operating income compared with the previous year. Operating income increased by 23 per cent to NOK 34.1 billion in 2013. Value added rose from NOK 7.2 billion to NOK 9.0 billion in the same period; an increase of 24 per cent. The number of employees was on a par with the previous year and amounted to around 7 000 in 2013.
The industry group ‘passenger transport rail transport, interurban’ also had a good year in 2013, with a 12 per cent increase in operating income to NOK 7.1 billion. Gross operating surplus increased by 31 per cent to NOK 1.6 billion, while the number of local KAUs was 60, unchanged from 2012.
Stable growth for freight transport
Operating income for industry groups within freight transport showed a steady growth from the year before. The industry group ‘freight transport by road and removal services’ had operating income of NOK 48.4 billion in 2013; an increase of 4.7 per cent compared with 2012. Operating income for the industry group ‘sea and coastal freight water transport’ rose by NOK 7.8 billion to over NOK 132 billion in 2013. Operating income for ‘freight air transport and space transport’ amounted to NOK 408 million in 2013; an increase of 9 per cent compared with the year before.
Growth for the industrial section transportation and storage
The industry section ‘transportation and storage’, which includes ‘land transport’, ‘water transport’, ‘air transport’, ‘warehousing’, and ‘postal and courier’ industry divisions, had total operating income of NOK 379 billion in 2013. This was an increase of under NOK 23 billion from the year before. Value added reached nearly NOK 145 billion; 16 per cent more than in 2012. Gross operating surplus rose by 12 per cent to less than NOK 61 billion. The number of local KAUs and employees in the industry section was largely unchanged during the period, amounting to 22 400 local KAUs and 152 800 employees in 2013.
Joint tables in AprilOpen and readClose
Tables combining all industry sections, divisions and groups will be made available in Statbank at 10.00 am on Thursday 30 April.
The statistics is now published as Business statistics.
Contact
-
Statistics Norway's Information Centre
E-mail: informasjon@ssb.no
tel.: (+47) 21 09 46 42
