Decline in turnover for Norwegian subsidiaries abroad
Published:
In 2016, Norwegian enterprises had almost 4 400 foreign subsidiaries with a turnover of NOK 1 215 billion, a decrease of 5 per cent since 2015.
- Full set of figures
- Norwegian subsidiaries abroad
- Series archive
- Norwegian subsidiaries abroad (archive)
These Norwegian subsidiaries employed 284 000 persons. Manufacturing had close to 113 000 employees and was the most important industry for Norwegian subsidiaries abroad.
Majority in Sweden and the USA
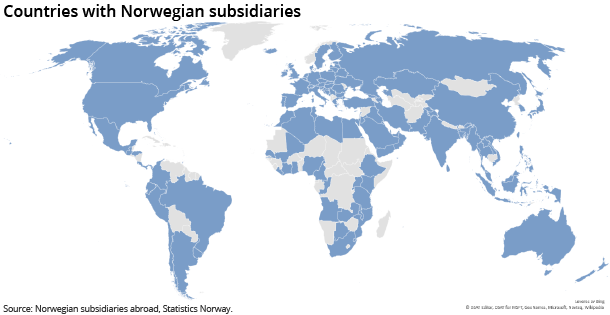
The geographical breakdown of the Norwegian subsidiaries abroad is presented in Figures 1 and 2. Figure 1 shows the distribution of the almost 4 400 Norwegian subsidiaries across 124 countries. In 2016, Sweden had 890 Norwegian subsidiaries, followed by the USA, Denmark and Great Britain, with 296, 276 and 269 subsidiaries respectively.
Figure 2 illustrates the presence of subsidiaries by continent and shows that Europe had 70 per cent of all the Norwegian subsidiaries abroad, equivalent to more than 3 000 enterprises. This was followed by, Asia and North and Central America, with roughly 600 and 400 subsidiaries respectively. The distribution of subsidiaries by continent was approximately the same as in 2015.
Figure 2. Number of enterprises, by continent, per cent of total
| Per cent | |
| Europe | 69.5 |
| Asia | 13.8 |
| North and Central America | 9.5 |
| South America | 2.8 |
| Africa | 2.8 |
| Oceania | 1.6 |
Labour-intensive in Asia
Turnover and employment by continent is presented in Figure 3 and shows the close relationship between the two variables. The continents had about the same share in employment and turnover of the total, with two exceptions. North and Central America and Asia deviated from the pattern because the most important industry in North and Central America was capital intensive, while Asia was dominated by labour-intensive industries.
Figure 3. Employment and turnover, by continent, per cent of total
| Turnover | Employment | |
| South-America | 6.4 | 8.0 |
| Oceania | 0.7 | 0.6 |
| North-and Central-America | 17.1 | 10.5 |
| Europe | 60.2 | 59.8 |
| Asia | 12.7 | 18.9 |
| Africa | 2.9 | 2.1 |
Europe was clearly the largest continent, with approximately 60 per cent of turnover and employment in 2016. North and Central America had a turnover of NOK 208 billion and employed close to 30 000 persons, making it the second largest continent in terms of turnover, and third largest, after Asia, measured by persons employed. All continents showed a decrease in turnover for 2016.
5 per cent of the countries accounted for over 50 per cent of total turnover
Figure 4 shows how the six countries accounted for 55 per cent of the total turnover of Norwegian subsidiaries abroad in 2016. The subsidiaries in Sweden had the highest turnover with NOK 194 billion, equivalent to 16 per cent of total turnover. The USA and Denmark had a turnover of NOK 170 billion and NOK 119 billion respectively. Compared to last year, the turnover in these countries had declined by 3.2 per cent, and the subsidiaries in Sweden were the only ones to see an increase in turnover in 2016.
Figure 4. Turnover, by selected countries, per cent of total
| Per cent | |
| Sweden | 15.9 |
| United States | 14.0 |
| Denmark | 9.8 |
| Germany | 5.6 |
| Brazil | 5.5 |
| Great Britain | 4.6 |
| Other countries | 44.6 |
The manufacturing industry accounted for a turnover of NOK 506 billion, equivalent to 42 per cent. This made manufacturing the largest industry for Norwegian subsidiaries abroad in 2016. The relationship between turnover and employment by industry is presented in Figure 5. It is worth noting that mining and quarrying had a significantly higher turnover per person employed compared with the other industries. The result is not surprising and simply reflects how capital intensive the extraction of crude oil and natural gas is.
Figure 5. Turnover (NOK mill) per employment, by industrial sector
| NOK mill | |
| Other industries | 0.80 |
| Accommondation and food service activities | 1.05 |
| Administrative and support service activities | 1.73 |
| Transportation and storage | 2.56 |
| Professional, scientific and technological activities | 2.98 |
| Information and communication | 3.05 |
| Construction | 4.46 |
| Manufacturing | 4.50 |
| Agriculture, forestry and fishing | 4.70 |
| Real estate activities | 4.75 |
| Financial and insurance activities | 5.43 |
| Wholesale and retail trade | 5.87 |
| Electricity and gas, water supply, sewerage, waste | 6.63 |
| Mining and quarrying | 15.88 |
Contact
-
Siri Lozano-Handelsby
-
Caroline Dahl
-
Statistics Norway's Information Centre

