Strong export growth
Published:
The total export of goods and services in the 3rd quarter was the highest since the start of the millennium. The preliminary estimate is more than NOK 348 billion.
- Full set of figures
- International accounts
- Series archive
- Balance of payments (archive)
More than 80 per cent of the growth from the 2nd quarter is due to an increase in the export of crude oil and natural gas as a consequence of growth in prices of oil and natural gas. In total, the export of crude oil and natural gas represents 42 per cent of the total export, according to updated figures from balance of payments.
Export of other goods down – export of services up
The export value of other goods, which means other than crude oil and natural gas, and other than ships, declined by NOK 5 billion in the 3rd quarter of 2018 from a high level in the previous quarter. The export of services, on the other hand, increased by NOK 9 billion, to a record high.
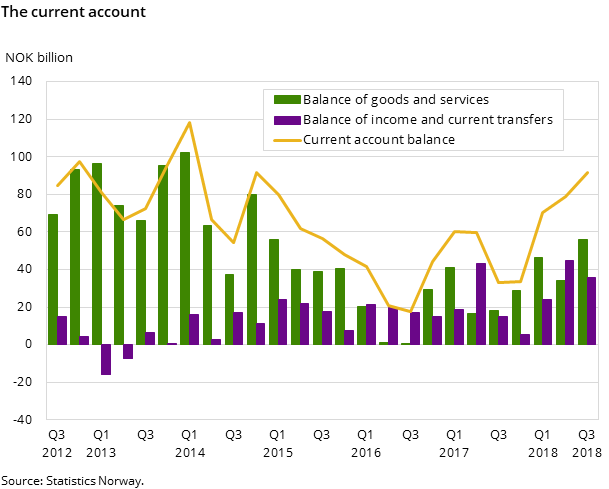
The import is about NOK 5 billion lower than in the 2nd quarter, but higher than the average of the imports of the four previous quarters. The balance of goods and balance of services are both higher than in the previous quarter. This is also the case when comparing with the same quarter of the previous year. The balance of goods and services is preliminarily calculated at NOK 56 billion, up from NOK 34 billion in the 2nd quarter. The preliminary figures on exports and imports in the 3rd quarter are more reliable for goods than for services. For more information about export and import, including price and volume considerations and seasonal adjustments, please see the quarterly national accounts .
Income and current transfers
Income and current transfers from abroad were measured at almost NOK 104 billion in the 3rd quarter of 2018, which was high compared to the corresponding quarter in 2017. Compared to the 2nd quarter in 2018, however, the income was substantially lower. When it comes to the income components these have to be interpreted in light of significant seasonal effects. With income to abroad measured at NOK 68 billion the balance of income and current transfers amounts to almost NOK 36 billion. Added with the balance of goods and services this gives a current account balance of almost NOK 92 billion in the 3rd quarter. This is the highest current account balance since 2014.
Increased financial investments abroad
The financial account shows positive financial transactions on both the asset and liability side in the 3rd quarter of 2018. The asset side saw a rise of NOK 100 billion, while the liability side increased by NOK 42 billion, which gave an increase in net lending of NOK 58 billion.
Portfolio investments increased substantially on the asset side, with a rise in equity abroad of NOK 54 billion. The Government Pension Fund Global (GPFG) was the main contributor. The NOK 43 billion rise in debt securities was also driven by the GPFG, together with deposit-taking corporations except the central bank.
On the liability side, the financial account shows an increase in portfolio investments in Norway of NOK 28 billion. Here, both non-financial and deposit-taking corporations incurred liabilities in debt securities.
Contact
-
Håvard Sjølie
-
Mats Kristoffersen
-
Linda Wietfeldt
-
Einar Goplen
-
Statistics Norway's Information Centre

