Content
Published:
This is an archived release.
Record high external trade in 2008
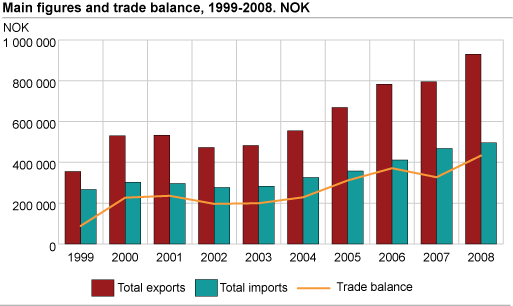
In 2008, exports ended at NOK 918.4 billion, while imports reached NOK 484.1 billion. The trade surplus came to NOK 434.3 billion, up 33.20 per cent from 2007.
Figures for December 2008 and a table showing the main figures for the year 2008 are available here.
Preliminary figures for the trade balance in 2008, for external trade excluding ships and oil platforms, came to NOK 434.3 billion. The trade surplus in 2008 is due to increased mainland exports (up 16.8 per cent) and a 5.2 per cent growth in imports. Exports excluding ships, oil platforms, crude oil, condensates and natural gas went up 7.4 per cent from 2007 to 2008.
High oil prices in 2008
In 2008, the total export value of crude oil, natural gas and condensates came to NOK 558.6 billion. The export value of crude oil alone was NOK 355.6 billion, and the value of exports of natural gas came to NOK 192.8 billion. Condensates ended at NOK 10.3 billion.
The average crude oil price was NOK 426 per barrel in 2007 and NOK 539 per barrel in 2008. High crude oil prices pushed income from exports up in 2008. For a period in 2008, the crude oil price reached a record high of NOK 700 per barrel. However, prices fell below NOK 300 per barrel in December.
High exports
The export value of goods excluding ships, oil platforms, crude oil, condensates and natural gas came to NOK 359.8 billion in 2008, up 7.4 per cent from 2007.
The table shows selected commodity groups and their effect on the value of exports. Machinery and transport equipment contributed to the growth in 2008 and reached NOK 76.3 billion, up 17.2 per cent from the previous year. Within this group, general industrial machinery, electrical machinery and machinery specialised for particular industries helped strengthen exports in 2008.
Chemicals and related products went up 11.6 per cent, ending at NOK 44.5 billion. The increase is also partly due to other chemical products, organic chemicals and fertilizers. Within mineral fuels, lubricants and related materials, oil and gas are the largest commodities. Refined mineral products also showed a high value in 2008, up 11.9 per cent or NOK 4.5 billion. Electric current climbed 107.2 per cent from 2007, ending at NOK 6.4 billion in 2008. Manufactured goods ended at NOK 89 billion, down 9.1 per cent compared to the previous year. Non-ferrous metals fell 21.1 per cent or NOK 13.1 billion. Iron and steel increased 35 per cent and came to NOK 17.8 billion.
Exports of fish
The export value of fish goods in 2008 came to NOK 37.8 billion, up 5.8 per cent or NOK 2.1 billion from 2007.
Russia was our largest market for fish exports in 2008, both in terms of quantity and value. Russia imported Norwegian fish for NOK 4 billion in 2008, compared with NOK 3.6 billion in 2007. Next we find France, closely followed by Denmark and Poland.
Farmed salmon was the largest commodity of fish in 2008. Frozen herring, frozen mackerel and dried cod were also important in the Norwegian export of fish.
Increased imports
Imports of goods in 2008, excluding ships and oil platforms, came to NOK 484.1 billion. Corresponding figures for the previous year ended at NOK 460.2 billion. This is an increase of 5.2 per cent. The increase in imports in 2008 was partly due to the commodity group machinery and transport equipment, which ended at NOK 15.2 billion.
The table above shows selected commodity groups and their effect on the value of imports. Imports of manufactured goods came to NOK 81 billion. Manufactures of metals went up, and non-ferrous metals fell in 2008.
Chemicals and related products ended at NOK 45.3 billion, an increase of 9.3 per cent. The increase is partly due to other chemical products and medicinal and pharmaceutical products. The imported value of food and live animals reached NOK 26.7 billion, an increase of 9.9 per cent from 2007. Crude materials, inedible, fell 10.1 per cent in 2008 and came to NOK 37.9 billion. Metalliferous ores and metal scrap contributed to the fall with a fall of 15.9 per cent and NOK 5 billion.
Trade with countries
Our most important trade region was the European Union. In 2008, trade with the EU amounted to 68.8 per cent of our imports, excluding ships and oil platforms. This is an increase of 5 per cent from 2007. Exports, excluding ships, oil platforms, crude oil, condensates and natural gas went up 5.5 per cent, and amounted to 67.3 per cent of total exports.
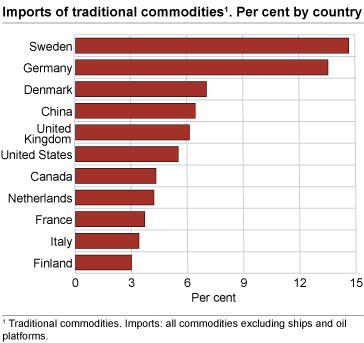
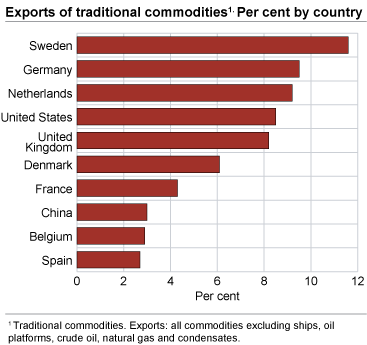
Sweden was our largest trading partner, both for imports and exports, excluding ships, oil platforms, crude oil, condensates and natural gas. Imports from Sweden reached NOK 70.9 billion and exports NOK 41.7 billion. In second place, we import the most from Germany, followed by Denmark, China, United Kingdom and United States. For exports, Germany is also the second largest recipient country, followed by the Netherlands, United States, United Kingdom and Denmark.
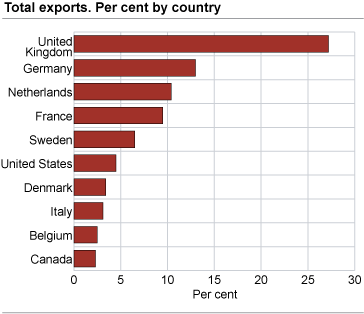
When ships, oil platforms, crude oil, condensates and natural gas are included, the order differs somewhat.
Large exports of crude oil and natural gas put United Kingdom at the top of the list, followed by Germany, the Netherlands and Sweden.
From 2007 to 2008, Asia increased exports to Norway by 13.1 per cent. China dominates the Asian market, with Japan in second place. Imports from China increased from NOK 27.8 billion in 2007 to NOK 31.1 billion in 2008. Imports from China amounted to 6.4 per cent of total Norwegian imports. Clothes are the most important commodity from China. In second place we find office machines and automatic data processing equipment, followed by telecommunications apparatus. China was our largest supplier of mobile telephones. Almost every fourth mobile telephone came from China in 2008.
Tables
This page has been discontinued, see External trade in goods, Monthly and External trade in goods, Annually.
Contact
-
Information services external trade
E-mail: utenrikshandel@ssb.no
-
Nina Rolsdorph
E-mail: nina.rolsdorph@ssb.no
tel.: (+47) 41 51 63 78
-
Jan Olav Rørhus
E-mail: jan.rorhus@ssb.no
tel.: (+47) 40 33 92 37


