Content
Published:
This is an archived release.
Lowest trade surplus in four years
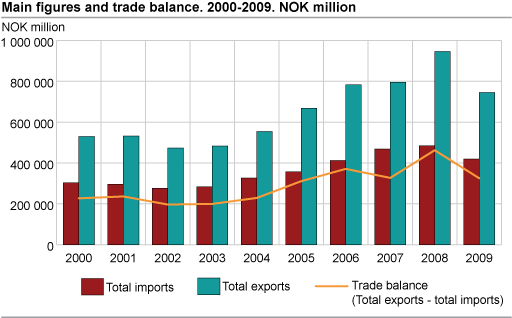
In 2009, exports amounted to NOK 745.3 billion, while imports ended at NOK 420 billion. This gave a trade surplus in 2009 of NOK 325.3 billion. This shows a decrease of almost 30 per cent from 2008 and is the lowest trade surplus in four years.
Figures for December 2009 and a table showing the main figures for the year 2009 are available here.
According to preliminary figures for 2009, the trade balance, excluding ships and platforms amounted to NOK 325.3 billion. This indicates a 30 per cent decline, equivalent to NOK 137.2 billion compared to last year. A decline in export value is the dominant cause of the decline in the trade balance. The value of the exports for 2009 is at the same level as in 2005. Mainland exports declined 14.9 per cent, or NOK 53.4 billion. The figures also show a decline in import values in the last year.
Low oil price in 2009
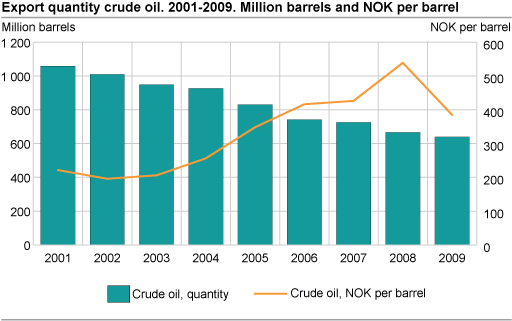
In 2009, the total export value of crude oil came to NOK 246.6 billion. This equals a drop of NOK 112.8 million, or 31.4 per cent from last year. We exported 26.1 million fewer barrels of crude oil in 2009 - ending at 640.4 million barrels in total. The average crude oil price dropped from NOK 539 per barrel in 2008 to NOK 385 per barrel in 2009. In the first months of 2009 the crude oil price bordered as low as NOK 300 per barrel. Both low prices and less exported barrels gave less crude oil income in 2009; a reminder of the financial difficulties in 2008.
The total exported value of natural gas amounted to NOK 187.1 billion, down 14.2 per cent from the previous year. Exported quantity of natural gas, in gaseous state, was the highest registered so far, ending at NOK 96.6 billion cubic metres.
Reduced exports of metals and machines
Preliminary figures for 2009 show the international financial setback continues to influence the Norwegian trade pattern. The export value of goods excluding ships, oil platforms, crude oil, condensates and natural gas came to NOK 305.1 billion in 2009; down 14.9 per cent and NOK 53.4 billion from 2008.
Several commodity groups pulled down the exported value in 2009. Among these we find the group of manufactured goods, which reached a value of NOK 63.5 billion. This represents a decline from 2008 of NOK 24.7 billion or 28 per cent for this commodity group. It was particularly the group of metals other than iron and steel and iron and steel products which pulled down the export value, with NOK 14.5 and NOK 8.3 billion respectively. Unwrought aluminium alloys dropped both in price and quantity during 2009, resulting in a NOK 8.8 billion decline in exported value compared with 2008.
The group machinery and transport equipment also declined somewhat in 2009 compared with the previous year. The export value for this commodity group ended at NOK 74.9 billion; down 1.9 per cent from 2008. While the export of electrical machinery and apparatus fell by NOK 2.1 billion from 2008, the export of machinery specialised for particular industries increased by NOK 3.1 billion. In addition, the export value of telecommunication devices increased by NOK 247 million in 2009.
Exports of chemical products fell by NOK 6.8 billion over the same period in 2008 and ended at NOK 37.6 billion. All sub-groups showed a decline within this commodity group, except other chemical products, which had a total export value of NOK 16.9 billion in 2009; an increase of NOK 1.7 billion from last year.
The largest commodities in the group of fuels, lubricants and electricity are oil and gas. Other products in this group also contributed to pushing the export value down in 2009. Refined petroleum products declined by 30.5 per cent or NOK 13 billion. Exports of both liquid propane and butane, as well as electric power, fell by NOK 5.1 and NOK 2 billion respectively compared with last year.
Top year for Norwegian fish
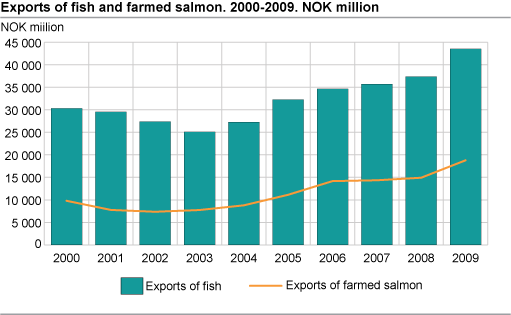
Exported value of fish reached NOK 43.5 billion in 2009. The export value increased by 16.4 per cent, equivalent to NOK 6.1 billion compared with the 2008 figures. With respect to volume, Russia was the single top receiver of Norwegian fish in 2009, with a total of 389 547 tonnes. When we look at the export value, France was at the top of the list. The French market imported Norwegian fish with a value of NOK 4.7 billion in 2009.
Farmed salmon continues to be the most important fish product in 2009, with export revenues which increased from NOK 13.8 billion in 2008 to NOK 17.6 billion in 2009. Frozen herring, frozen mackerel and dried cod were other important fish species.
Reduced imports
Imports of goods, excluding ships and oil platforms, amounted to NOK 420 billion in 2009; down 13.3 per cent from NOK 484.3 billion in 2008.
The imports were reduced within several commodity groups in 2009. Amongst these was the import of machinery and transport equipment, which reached a total value of NOK 162.6 billion; down NOK 25.6 billion, or 13.6 per cent. The total import value of “vehicles for roads” was NOK 35 billion; a decrease of NOK 9.5 billion from 2008. We imported 20 500 fewer cars in 2009, ending at a total of 140 300 vehicles. In particular, the imports of German (- 8 000), American (- 5 000) and British (- 4 000) cars were reduced in 2009. Imports of cars from Sweden increased by 2 500 in 2009. In addition, the group machinery specialised for particular industries and general industrial machinery, decreased by NOK 4.9 billion and NOK 4.4 billion respectively compared with the previous year.
Imports of manufactured goods also showed a decline in 2009. The total imports reached NOK 64.6 billion – NOK 16.3 billion less than in 2008. All sub-groups of commodities showed a decline in 2009. Metals other than iron and steel showed the greatest decline, in addition to the group of articles of metals.
Imports of inedible crude materials decreased by 34.3 per cent and amounted to NOK 24.9 billion in 2009. The commodity group ores and metal scrap contributed to the drop, with a decline of NOK 11.1 billion to NOK 15.4 billion compared with the previous year.
The group chemical products has also shown a decline in 2009. Total imports fell by NOK 1.8 billion, while medical and pharmaceutical products increased by NOK 496 million and pulled in the opposite direction.
Increased trade with China and South Korea
Preliminary figures for 2009 show a decline of export, excluding ships, oil platforms, crude oil, condensates and natural gas, to all continents except Asia and Africa. The value of goods imported, excluding ships and oil platforms, to Norway has also dropped from all continents, except South America, compared with 2008. Europe is still, indisputably, Norway's most important trading partner, with a share of 67 per cent of exports and 71.9 per cent of imports.
Exports to the EU amounted to NOK 185.8 billion in 2009, 23 per cent lower than in 2008. Exports to the EU have thereby fallen by NOK 55.4 billion since last year. Imports from the EU ended at NOK 282.8 billion, and were 15 per cent lower than the year before. Among individual countries, Sweden is still our most important trading partner both in terms of imports and exports. In 2009, Sweden supplied us with goods worth NOK 59.2 billion and received Norwegian exports worth NOK 30.8 billion. This implies a decline in trade with our closest neighbours at NOK 11.6 billion on the import side and NOK 10.9 billion on the export side.
Germany comes in second place in terms of both imports and exports in 2009. On the import side, China has caught up to third place, in terms of overall share of the Norwegian trade by 7.6 per cent, while the USA comes in fourth place with 6.9 per cent. On the export side, the USA takes third place followed by the Netherlands with 8.4 and 7.6 per cent of the total share respectively.
Exports to Asia increased by 15.5 per cent from 2008, and amounted to just above 19 per cent of the exports in 2009. This implies an increase of NOK 7.9 billion since last year. Imports from Asia showed a slight decrease from 2008 and accounted for 15 per cent of the imports in 2009. China dominates the trade with Asia, both in terms of imports and exports. The figures for 2009 also show a growth in trade with South Korea. Exports to South Korea are dominated by machinery, iron and steel products, as well as fish and oil. The increased trade with South Korea is partly due to the effect of the trade agreement between EFTA countries and South Korea, which came into force in 2006.
Despite the upturn in exports to Africa, trade with the continent still accounts for a marginal part of Norway's foreign trade with a share below 2 per cent in terms of both imports and exports. The Oceanian countries are the area in which we trade the least with, with only 0.5 per cent of exports and 0.2 of imports in 2009.
Tables
This page has been discontinued, see External trade in goods, Monthly and External trade in goods, Annually.
Contact
-
Information services external trade
E-mail: utenrikshandel@ssb.no
-
Nina Rolsdorph
E-mail: nina.rolsdorph@ssb.no
tel.: (+47) 41 51 63 78
-
Jan Olav Rørhus
E-mail: jan.rorhus@ssb.no
tel.: (+47) 40 33 92 37


