Content
Published:
This is an archived release.
Increased mainland exports in 2010
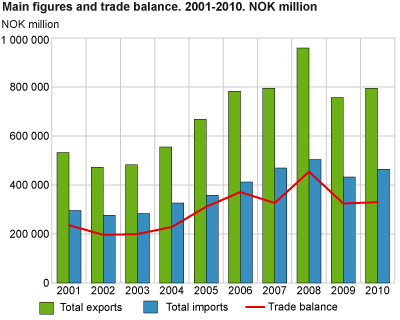
Norway’s mainland exports in 2010 amounted to NOK 333.7 billion. Joint exports of shelf commodities; crude oil, natural gas and condensates also increased compared with 2009. Imports rose in the same period. Consequently, the trade surplus grew by NOK 19 billion.
Figures for December 2010 and a table showing the main figures for the year 2010 are available here.
According to preliminary figures for 2010, the trade balance, excluding ships and platforms amounted to NOK 341.5 billion. This equals a 6 per cent increase compared to 2009. The trade surplus last year is a result of increased mainland exports, up 9 per cent or NOK 28.8 billion, together with a 5 per cent growth in imports. Crude oil exports also went up in 2010, despite of a reduction in volume. Exports of natural gas went the other way; increased volume but lower value. If we were to divide the trade surplus between the Norwegian population, we would each receive about NOK 70 000.
Increased crude oil prices
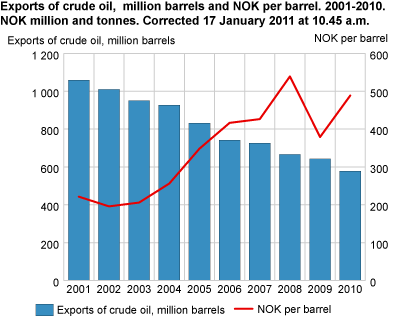
The export value of crude oil in 2010 reached NOK 282.5 billion. In 2009 the value was NOK 243.5 billion. The positive development last year was mainly due to higher crude oil prices compared with the previous year. The average crude oil price went up NOK 110, from NOK 379 per barrel in 2009 compared to NOK 489 per barrel in 2010. On the other hand, the number of exported barrels of crude oil declined in 2010, from 642 million barrels in 2009 to 578 million barrels.
High quantity of natural gas exports
In 2010 we exported 97.3 billion Sm3 (Standard Cubic Metres) of natural gas in gaseous state. This was 763 million Sm3 more than the previous year. However, the same natural gas exports came to NOK 161.7 billion last year; a decrease of NOK 25.2 billion from 2009. This was caused by lower natural gas prices.
Metal exports up
In 2010 the mainland exports reached NOK 333.7 billion. This was a 9 per cent increase from NOK 305 billion the year before.
Most main export groups increased last year compared with 2009. Exports of manufactured goods came to NOK 74.7 billion, up 18 per cent this year. Especially metals rose in this period, totalling NOK 56 billion.
Prices of raw materials, such as metals and other commodities, rose in 2010. Prices of metals are strongly influenced by the combination of demand and supply. The Chinese economy overcame the global financial crisis quite well, and drove up the demand for raw materials such as metals.
Exports of chemicals and related products went up 21 per cent, ending at NOK 45 billion. Most groups contributed to this growth.
Within the exports of mineral fuels, lubricants and related materials, refined mineral products together with liquefied propane and butanes increased, ending at NOK 31.6 and NOK 17.3 billion respectively.
Miscellaneous manufactured goods came to NOK 20.5 billion; almost the same as in 2009.
On the other hand, exports of machinery and transport equipment declined, ending at NOK 67.9 billion – a decrease of NOK 7.1 billion in 2010. Within this group, machinery specialised for particular industries and general industrial machinery fell, as did power generating machinery.
New record year for fish exports
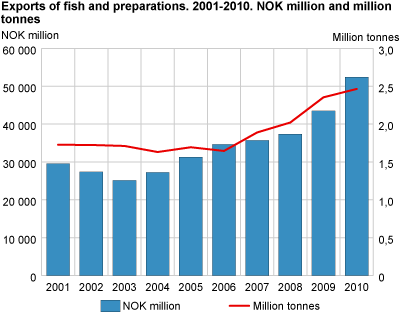
There have been seven consecutive years with a record high export of fish. In 2010 the export value of fish reached NOK 52.4 billion, up a total of NOK 8.9 billion or 21 per cent from the previous year. The exported quantity amounted to 2.5 million tonnes of fish in 2010.
France and Russia were our largest markets for fish exports. We exported Norwegian fish for NOK 5.3 billion to the French, while the Russians received Norwegian fish for NOK 5.2 billion. Both the French and the Russians use our fish for consumption. The exports of fish to Denmark and Poland, which follow in the next places, are mainly used for processing.
In 2010 the fish exports collectively to Japan, China and Hong Kong amounted to NOK 5.5 billion. This was an increase of 34 per cent and NOK 1.4 billion from the previous year. The Norwegian exports of fish to the USA came to NOK 2.5 billion last year – up NOK 886 million from 2009. Products of salmon, mainly fillets are popular in the USA.
Our most important fish commodity was fresh farmed salmon, with an export value of NOK 23.2 billion. Increased quotas for mackerel and herring also resulted in record high exports and were mostly shipped to Asian countries like Japan and China. In the same period, exports of dried cod went up 10 thousand tonnes, ending at NOK 1.8 billion in 2010.
Growing imports
Imports of goods, excluding ships and oil platforms, amounted to NOK 447.2 billion in 2010, representing an increase of 5.4 per cent, NOK 23.0 billion, compared to 2009. Nevertheless, last year’s imports were lower than in 2007 and 2008.
Less machinery, but increasing car imports
Machinery and transport equipment, which are our main articles of import, showed a decline of 4 per cent in total, reaching NOK 160.3 billion. “Vehicles for roads” was the single most important commodity with a recorded import value of NOK 43.8 billion, accounting for a growth of 25 per cent. The commodity group “other transport equipment”, which mainly includes aeroplanes and special vessels, and therefore varies, fell by 42 per cent to NOK 13.4 billion.
The value of imported cars rose by 35 per cent to NOK 26.0 billion from 2009 to 2010. Measured in numbers, we imported approximately 178 500 cars. This represented a growth of 30 per cent compared to 2009. Germany is our main supplier of cars, accounting for 40 per cent of all imported passenger cars last year. The number of German cars rose by more than 14 000 compared to 2009. Other major car producing nations like Japan, France, United Kingdom and Sweden also increased their exports to Norway.
The imports of several types of machinery showed a decrease in 2010. General industrial machinery, power generating machinery and machinery specialised for particular industries, fell altogether by NOK 6.7 billion and totalled NOK 45.5 billion. On the other hand, office machines, including automatic data processing equipment, and telecommunications apparatus rose by around NOK 500 million each in 2010.
Mobile phones accounted for approximately a quarter of the imported value within telecommunications apparatus last year, growing with more than NOK 800 million. We received 2.8 million mobile phones in 2010 compared to 2.5 million the previous year. More than every third mobile phone originates from China.
High imports of electric current
The imports of electric current showed a sharp upturn both with respect to volume and value in 2010. Cold weather contributed to an import of 14.8 million MWh of electric current. The volume has almost tripled since 2009 and only in 2004 did we have a higher imported volume. The average price for the year 2010 was NOK 423 per MWh. This is the highest recorded yearly average price, with February and December as peak months.
Within the group consisting of crude materials, the import of metalliferous ores and metal scrap showed a strong growth of 45 per cent, amounting to NOK 22.2 billion last year. At the same time, petroleum, petroleum products and related materials rose by 22 per cent, and came to NOK 22.9 billion.
The imports of chemicals and related products also increased last year; up 10 per cent, and totalled NOK 47.7 billion. Organic chemicals had the highest growth, rising 30 per cent to NOK 6.4 billion.
While the imports of iron and steel fell by NOK 2.1 billion, the imports of non-ferrous metals rose by NOK 4.9 billion. The total imported values for these commodity groups were NOK 10.2 and 12.1 billion respectively.
The EU our largest trade area, Asian imports and North American exports up
European countries and particularly countries in the European Union , were our most important trade partners in 2010. Trade with the EU amounted to NOK 293.4 billion or 66 per cent of our imports, excluding ships and oil platforms. The mainland export to the same countries accounted for 61 per cent and NOK 204.7 billion. This equals an increase of NOK 19.1 billion for exports and NOK 6.8 billion for imports.
Excluding ships, platforms and shelf commodities, Sweden was our largest trading partner, both for imports and exports. Imports from our neighbour in 2010 came to NOK 65.5 billion and exports to NOK 35.6 billion. If we also include commodities from the continental shelf, we exported the most to the United Kingdom, followed by the Netherlands and Germany.
In 2010, imports from Asia went up 11 per cent. Among these countries, China dominates, with Japan in second place. Imports from China amounted to NOK 37.6 billion - up 17 per cent from 2001. The most important commodities from China were office machines and automatic data equipment, clothing, shoes and telecommunications apparatus. As an example, three out of five laptop computers came from China in 2010.
Our exports to the Asian countries increased, particularly to Japan, Hong Kong and Malaysia. This was mainly caused by high exports of fish.
Trade with countries in North America also increased in 2010. Imports from Canada went up more than 50 per cent from the previous year and came to NOK 14.7 billion, where products of metalliferous ores and metal scrap among others increased considerably. For exports, trade with the USA increased the most, up about a quarter, ending at NOK 32 billion. Fish commodities were among our most important export products to the USA.
Despite an upturn in trade with African countries, trade with the continent still accounts for a marginal part of Norway's foreign trade. Imports amounted to NOK 7.7 billion and a share below 2 per cent, while exports came to NOK 7.9 billion and a share just above 2 per cent.
The Oceanian countries are the area in which we trade the least with, accounting for only 0.5 per cent of exports and 0.2 per cent of imports in 2010.
Tables
This page has been discontinued, see External trade in goods, Monthly and External trade in goods, Annually.
Contact
-
Information services external trade
E-mail: utenrikshandel@ssb.no
-
Nina Rolsdorph
E-mail: nina.rolsdorph@ssb.no
tel.: (+47) 41 51 63 78
-
Jan Olav Rørhus
E-mail: jan.rorhus@ssb.no
tel.: (+47) 40 33 92 37


