Content
Published:
This is an archived release.
Record high natural gas exports
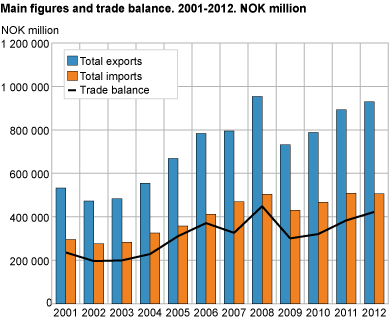
Imports of goods amounted to NOK 498.8 billion, while exports reached NOK 923.8 billion. The trade balance was therefore NOK 425 billion – NOK 30 billion more than last year. The export quantity of natural gas in 2012 was record high.
Figures for December 2012 and a table showing the main figures for the year 2012 are available here. |
The preliminary yearly figures for 2012 show an improved trade surplus by NOK 30 billion compared to the previous year. The trade surplus was due to a 1.5 per cent increase in imports and 4.2 per cent increase in exports. Mainland exports in 2012 were at the same level as in 2011. This indicates that shelf commodities, and exports of natural gas in particular enhanced the trade surplus in 2012.
Record year for natural gas exports
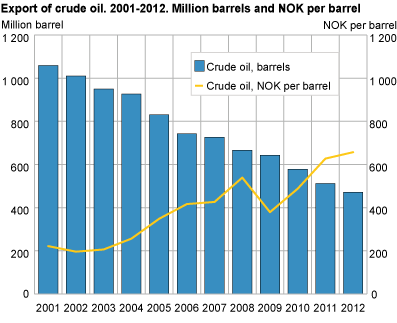
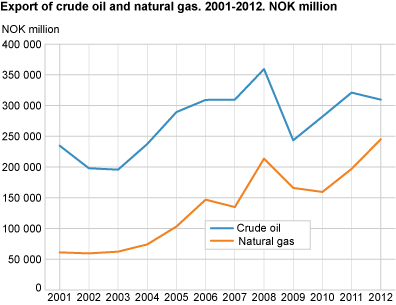
The total export value of crude oil, natural gas and condensates collectively came to NOK 563.3 billion in 2012. The export value of crude oil ended at NOK 309.6 billion, down 3.6 per cent or NOK 11.5 billion compared to the previous year. Despite higher average crude oil prices and a better US currency advantage in 2012, the number of exported barrels of crude oil declined in 2012, from 512 million barrels in 2011 to 471 million barrels. Crude oil prices on average went up NOK 30 per barrel in 2012, from NOK 627 per barrel in 2011 to NOK 657 per barrel in 2012.
The export quantity of natural gas in a gaseous state went up from 94.9 billion standard cubic metres (Sm3) in 2011 to as much as 108.2 billion this year. In total, the export value of natural gas reached NOK 245.2 billion, up NOK 48 billion compared to last year. Thus, the export value of natural gas drew nearer to the level of crude oil exports.
Stable mainland exports
In terms of the economy, 2012 was a turbulent year, marked by worldwide low growth. In particular, Europe; our most important trading partner, was severely hit by this downturn. The preliminary figures for 2012 show that the value of Norwegian exports of goods, excluding ships, oil platforms, crude oil, natural gas and condensates, came to over NOK 360 billion, which is on a par with 2011.
In 2012, Norway experienced high activity in the industry that delivers machinery to the oil sector. From 2011 to 2012, exports of machinery and transport equipment increased by 7.4 per cent, to a total of NOK 68.7 billion. The largest increase came in the sub-groups Machinery specialized for particular industries and General industrial machinery, which amounted to NOK 15.8 and NOK 16.6 billion respectively – a corresponding increase of NOK 3.3 and NOK 2.9 compared to the previous year. Also of note were the sub-groups Telecommunications equipment and Other transport equipment, which ended at NOK 5 and NOK 3.9 billion respectively in 2012. This is a decrease of NOK 1.6 and NOK 1.3 billion respectively compared to 2011.
Norway exported manufactured goods amounting to NOK 69.2 billion in 2012. This is an increase of NOK 7.3 billion compared to 2011. The decline was largely attributed to lower exports of non-ferrous metals, which amounted to NOK 39.9 billion in 2012. This was more than 14 per cent less compared to the previous year. The downturn was mainly due to lower aluminium prices in 2012. The sub-group paper and paperboards amounted to NOK 4.9 billion in 2012; a decrease of NOK 1.3 billion compared to the previous year.
Exports of chemicals and related products amounted to NOK 40.7 billion in 2012. This is a decrease of 11.1 per cent compared to the previous year. The sub-group other chemical products decreased the most, down 15.7 per cent from 2011 to 2012 to a total of NOK 19.6 billion. The closing down of the solar industry is the main cause of this decrease.
Lower exports of fish
Fish with a total value of NOK 50.9 billion were exported in 2012. This is NOK 1.3 billion, or 2.4 per cent, less than the previous year. Russia and Poland were our most important export markets, with exports of NOK 5.9 and NOK 4.9 billion respectively.
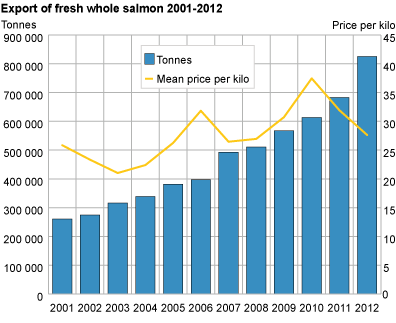
The most important fish product was fresh farmed whole salmon. This product amounted to NOK 22.8 billion in 2012 and thereby constituted 44.8 per cent of all fish exports. More than 825 000 tonnes of salmon were exported in 2012, which is a new record. In spite of the clear increase in export volume, the value of exports only increased by 4.7 per cent. This was due to the low average price in 2012 compared to 2011. By comparison, the average price per kilo was NOK 32 in 2011 compared to NOK 28 in 2012.1
Record high imports
In 2012, the total value of imported goods, excluding ships and oil platforms, was NOK 498.8 billion; a rise of 1.5 per cent and NOK 7.3 billion from the record year 2011.
Machinery and transport equipment was the commodity group with the highest import, ending at NOK 185 billion; NOK 7.4 billion and 4.1 per cent more than in 2011. The most important sub-groups were road vehicles and other transport equipment, general industrial machinery as well as electrical machinery, amounting to NOK 51.4, NOK 27.1 and NOK 24.9 billion respectively. Imports of passenger cars alone came to NOK 30.6 billion in 2012. Almost 194 000 passenger cars were imported, however this was about 600 fewer than the previous year. This indicates that the average car in 2012 was more expensive than the one in the year before. We continued to get the most passenger cars from Germany, in total 73 000 this year, followed by Japanese and French cars, with 25 000 and 17 000 respectively. A record number of mobile phones were also imported in 2012 - enough for every second Norwegian to receive a new one this year.
The decline in imports of inedible crude materials was NOK 5.9 billion in 2012 and the import value ended at NOK 33 billion. The sub-group metalliferous ores and metal scrap contributed to almost the entire fall. This decline reflects the current situation in the metal products industry, which is experiencing lower prices.
Fewer exports to Europe
Exports of mainland goods, excluding ships and oil platforms, to Europe fell from 2011 to 2012 from NOK 254.4 to NOK 249.4 billion. Trade with Europe accounted for about 70 per cent of exports and imports in 2012, which makes Europe the most important region for Norwegian trade. Sweden, the Netherlands and Great Britain were the countries we exported most to.
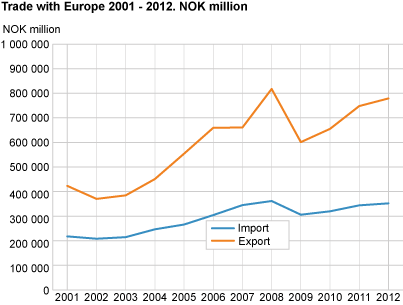
We imported goods, excluding ships and platforms, from European countries for a total of NOK 349.9 billion in 2012. This was an increase of 2.5 per cent compared to the previous year. Increased exports and decreased imports show that there was a difference in the economic situation between Europe and Norway. The countries we imported most from were Sweden, Germany and Denmark. Exports to the crisis struck countries Spain, Italy and Portugal decreased by 16.8, 16.3 and 10.7 per cent respectively from 2011 to 2012.
Increased trade with Asia
Trade with Asia amounted to 16 per cent of all exports and imports in 2012. Goods at a total value of NOK 58.2 billion were exported to the region in 2012, which was an increase of NOK 6 billion compared to the previous year. Most of this increase can be attributed to higher exports to South Korea, but also Singapore participated significantly. Exports to China dropped by 8.9 per cent to NOK 13.9 billion in 2012.
The rise in imports from the Asian countries came to 5.1 per cent in 2012; less than half the increase in exports. Imports without ships and platforms amounted to NOK 82.2 billion in 2012. China dominated as the largest Asian exporter of goods. A total of 9.2 per cent of imported goods came from China last year - a rise of 6.2 per cent compared to the previous year.
North America accounted for 10 per cent of the exports in 2012 and almost 12 per cent of imports. The value of exports to this part of the world amounted to NOK 35.9 billion in 2012; an increase of 7 per cent from 2011 to 2012. The drop was mainly attributed to lower exports of mineral oil to Canada, which fell by NOK 2.6 billion compared to the previous year. Last year’s exports to USA amounted to NOK 30 billion. This was a decrease of 1.5 per cent compared to 2011. Imports from North America amounted to NOK 44.2 billion, which was almost 12 per cent less than in 2011. The decrease was mainly due to a drop in imports from Canada of almost NOK 6 billion from 2011 to 2012.
Brazil continued to be our most important trade partner in South America. In 2012, we exported and imported goods here for NOK 4.9 and 8.5 billion respectively. This is a corresponding increase of 1.6 and 10.6 per cent. During 2012, we exported and imported goods each to the value of approximately NOK 8.5 billion. Exports increased by 19.1 per cent, while imports fell by 9.1 per cent.
1 The two last sentences were removed from this paragraph 15 January 2013 at 1630.
This page has been discontinued, see External trade in goods, Monthly and External trade in goods, Annually.
Contact
-
Information services external trade
E-mail: utenrikshandel@ssb.no
-
Nina Rolsdorph
E-mail: nina.rolsdorph@ssb.no
tel.: (+47) 41 51 63 78
-
Jan Olav Rørhus
E-mail: jan.rorhus@ssb.no
tel.: (+47) 40 33 92 37
