Content
Published:
Updated:
This is an archived release.
Reduced revenue from shelf commodities in 2014
Exports of goods came to NOK 897.8 billion in 2014 and dropped 0.9 per cent compared to 2013. Mainland exports increased by 6.5 per cent and offset falling oil and gas prices. Imports increased 6.2 per cent and reached NOK 560.7 billion.
| NOK Million | Share in per cent | Change in per cent | |
|---|---|---|---|
| 2014 | 2014 | 2013 - 2014 | |
| Imports | 560 723 | 100.0 | 6.2 |
| Ships and oil platforms | 10 757 | 1.9 | -1.3 |
| Exports | 897 810 | 100.0 | -0.9 |
| Crude oil | 269 601 | 30.0 | -3.0 |
| Natural gas | 224 988 | 25.1 | -9.5 |
| Natural gas condensates | 8 007 | 0.9 | -3.2 |
| Ships and oil platforms | 7 099 | 0.8 | 1.5 |
| Mainland exports | 388 115 | 43.2 | 6.5 |
| The trade balance | 337 087 | . | -11.0 |
| The mainland trade balance | -161 851 | . | -6.3 |
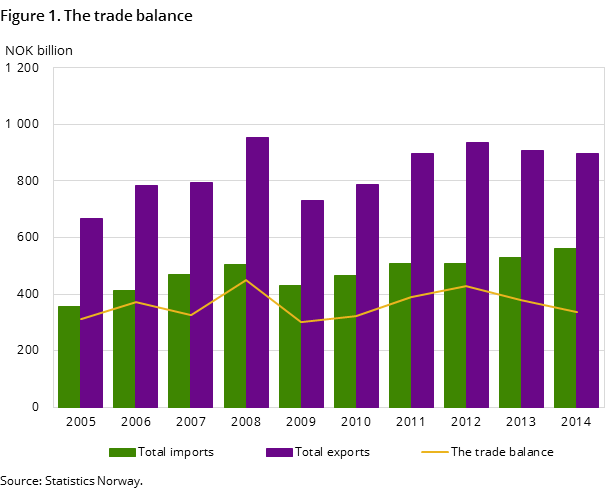
The trade balance ended at NOK 337.1 billion, down 11 per cent compared to 2013.
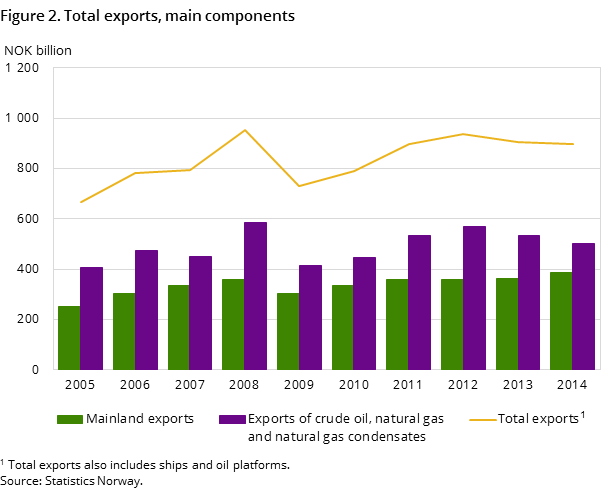
Exports of crude oil and natural gas amounted to NOK 494.6 billion in 2014, and accounted for 55.1 per cent of total merchandise exports. This is a decline of 6.1 per cent compared to 2013. Increase in exports of fish, metals and industrial machinery contributed to growth in mainland exports, which went up 6.5 per cent from 2013 to NOK 388.1 billion in 2014.
Significant drop in oil and gas prices
Natural gas exports totalled NOK 225 billion in 2014, down 9.5 per cent compared to 2013. The decrease was mainly due to lower natural gas prices, which as an annual average fell by 11 per cent compared to 2013. The export volume was 102.6 billion cubic metres; a drop of 1.2 per cent.
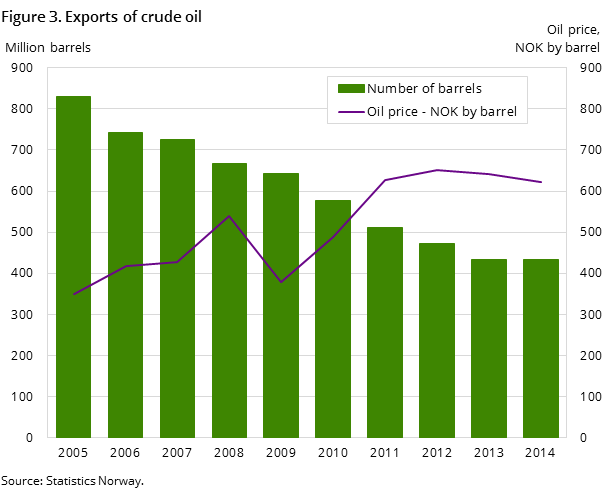
The export value of crude oil was also affected by lower prices. Exports declined by 3 per cent compared to 2013, ending at NOK 270 billion. Oil prices have fallen sharply since June in 2014 and the annual average price per barrel was NOK 622 in 2014 compared to NOK 642 in 2013. A total of 434 million barrels were exported, which was the same level as in 2013.
Record export of fish
Mainland exports reached NOK 388.1 billion in 2014 and were 6.5 per cent higher than in 2014.
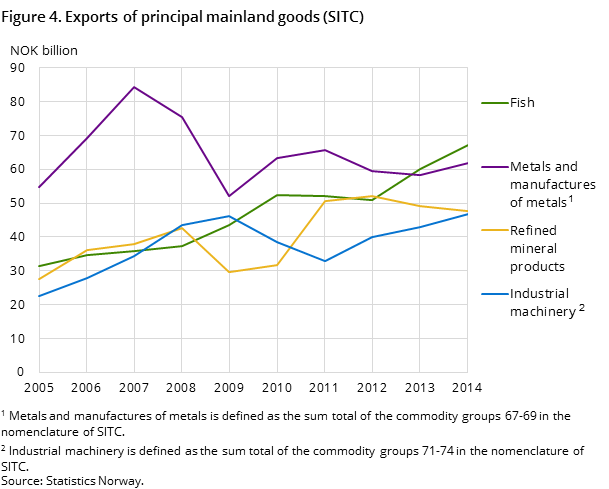
The largest increase was in fish exports, which reached a new peak in 2014. Exports went up by 11.6 per cent from 2013, to just over NOK 67 billion in 2014. This was despite Russia’s import ban, which has been the main export market for Norwegian fish.
Exports of metals totalled NOK 53.3 billion in 2014, and went up 12.6 per cent compared to 2013. In the opposite direction, exports of manufactures of metals dropped 22.3 per cent in 2014. This was due to higher exports of constructions to offshore installations in June 2013. A large increase was also found in exports of industrial machinery, which reached NOK 46.8 billion in 2014, up 9.2 per cent compared to 2013.
Record high imports
In 2014, imports reached a record level and amounted to NOK 560.7 billion, an increase of 6.2 per cent compared to 2013.
Doubled electric car imports
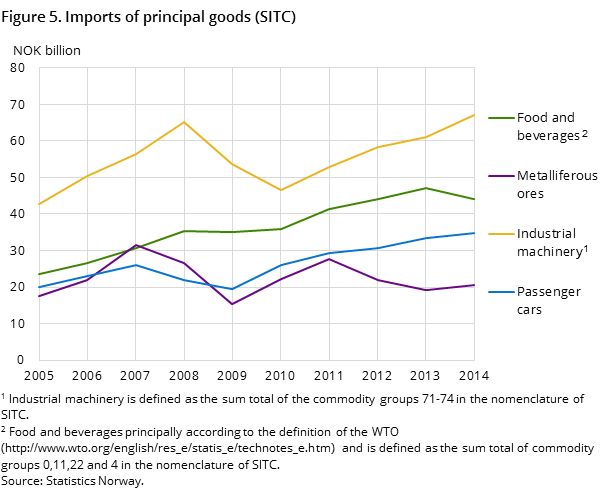
Imports of the main commodity group machinery and transport equipment totalled NOK 219.7 billion, which is NOK 15.4 billion, or 7.5 per cent, more than the year before. Road vehicles, other industrial machinery and electrical machines had an import value of NOK 56.1 billion, NOK 32.3 and NOK 30.6 billion respectively in 2014. Imports of passenger cars alone reached NOK 34.9 billion and nearly 194 000 cars were imported; slightly fewer than the year before. In 2014, the average car was more expensive than in 2013. Electric cars continue to grow in popularity, and we doubled our imports in 2014.
Imports of other transport equipment increased by 13.9 per cent and came to NOK 28.2 billion. However, as this commodity group among others contains ships and aircrafts, values fluctuate between periods. In July we imported an oil platform amounting to NOK 4.7 billion, explaining the increase in 2014.
Also, we received other consumable goods such as clothing, shoes, furniture at a value of NOK 35 billion, over NOK 2 billion more than in 2013. Meanwhile, we imported 2.7 million mobile phones in addition to 1.8 million computers and tablets; the same as the year before - enough for everyone in the population aged 7 and older to get a new computer in 2014.
High imports of metals
Imports of the main commodity group manufactured goods increased by NOK 9.3 billion compared to 2013 and came to NOK 85.7 billion. Metal goods imports saw a particular increase. The growth is explained by an increase in volume and higher prices for metal goods other than iron and steel.
Also, the import value of the main commodity group non-edible raw materials went up in 2014. The total imports rose by nearly NOK 2.1 billion and reached NOK 32.4 billion. Metalliferous ores and metal scrap accounted for almost the entire growth.
Fuel oil drop
In 2014, we received goods from the main commodity group crude materials to a value of NOK 31.1 billion; NOK 7.8 billion less than the year before. Particularly lower imports of fuel oil, with a decrease of NOK 3 billion, and almost half of the quantity, contributed to the drop. The reduction reflects a change in usage patterns by focusing on cheaper and more environmentally-friendly alternatives of heating.
Increase in mainland exports to China
Just over 60 per cent of the mainland export went to the EU market in 2014. The export value ended at NOK 241 billion and increased by 6.1 per cent compared to 2013. The Netherlands was the largest export market for the mainland goods in 2014, followed by Sweden and the UK. Mainland exports to Asia went up 12.6 per cent compared to 2013 and reached NOK 72.5 billion in 2014. Exports to China increased by 24.1 per cent and totalled NOK 20 billion. This was mainly due to a large increase in exports of industrial machinery, chemical products and fish. There was also a large increase in mainland exports to USA that amounted to nearly NOK 28 billion, up 10.4 per cent compared to 2013.
Europe our main trading area
In 2014, imports 'excluding ships and oil platforms' from European countries ended at NOK 381.3 billion, equivalent to an increase of 4.6 per cent from the previous year. The countries we imported most from were Sweden, Germany, UK and Denmark. From the European countries, we receive various types of machinery, cars, metal goods, fruits and vegetables as well as medicines and furniture.
Increased trade with Asia
Imports from Asian countries rose by 12.1 per cent in 2014 compared with the year before. Total import value for 'goods excluding ships and oil platforms' came to NOK 94.8 billion. China is totally dominating the Asian market, with well over half of the imported value. A total of 9.6 per cent of Norwegian imports originated from China in 2014, representing a growth from the previous year of 11.8 per cent.
We receive large quantities of mobile phones, computers and tablets, clothes and electrical machinery originating from Asian countries.
In 2014, North America accounted for 9.1 per cent of imports in terms of value. Our trade with the USA and Canada rose by about 20 per cent each, with NOK 34 and NOK 14 billion respectively. From countries in North America we imported important industrial products, such as machinery and ores for use in industry, in addition to technical instruments and vehicles.
Trade with the BRIC countries
Norway received more goods from the BRIC countries; Brazil, Russia, India, China, in 2014 than the year before. The exception was South Africa, where the import value was the lowest since 2007. From South Africa we got mainly ores, fruits and vegetables and non-ferrous metals and steel. Indian commodity imports were mostly the same as in 2013. Clothing and textiles are among the main items we receive from India. Brazil is an important supplier of raw commodities such as ores, foods, vegetables and fruits, in addition to coffee. Higher than normal temperatures and drought drove coffee prices up in early 2014 and have given Brazil a higher import value. Goods with Russian origin include goods such as metals except iron and steel, various oils (mineral, vegetable and animal), chemical products and articles of rubber.
This page has been discontinued, see External trade in goods, Monthly and External trade in goods, Annually.
Contact
-
Information services external trade
E-mail: utenrikshandel@ssb.no
-
Nina Rolsdorph
E-mail: nina.rolsdorph@ssb.no
tel.: (+47) 41 51 63 78
-
Jan Olav Rørhus
E-mail: jan.rorhus@ssb.no
tel.: (+47) 40 33 92 37
