Content
Published:
This is an archived release.
Higher exports of natural gas than oil
Exports decreased by 6.7 per cent from 2014 to 2015 and ended just under NOK 850 billion. The decline was caused by the low oil price. Exports of crude oil, at just below NOK 200 billion in 2015, are now lower than natural gas. Imports rose sharply, by 9.5 per cent, to NOK 614.1 billion.
| NOK Million | Share in per cent | Change in per cent | |
|---|---|---|---|
| 2015 | 2015 | 2014 - 2015 | |
| Imports | 614 091 | 100.0 | 9.5 |
| Ships and oil platforms | 26 416 | 4.3 | 143.7 |
| Exports | 847 744 | 100.0 | -6.7 |
| Crude oil | 199 833 | 23.6 | -29.3 |
| Natural gas | 227 906 | 26.9 | 1.9 |
| Natural gas condensates | 5 157 | 0.6 | -36.3 |
| Ships and oil platforms | 8 608 | 1.0 | 17.1 |
| Mainland exports | 406 239 | 47.9 | 5.1 |
| The trade balance | 233 653 | . | -32.8 |
| The mainland trade balance | -181 436 | . | -11.2 |
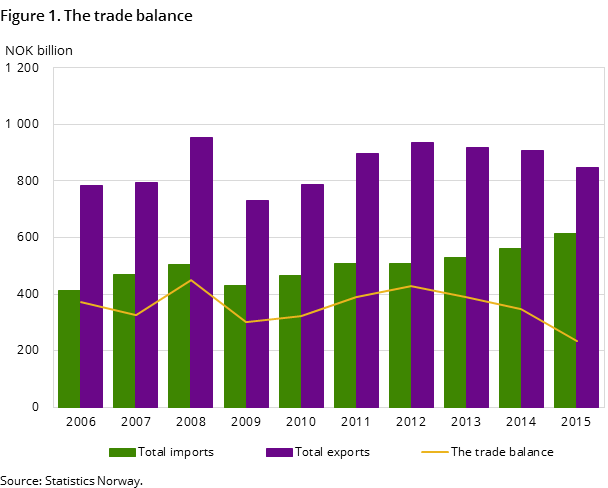
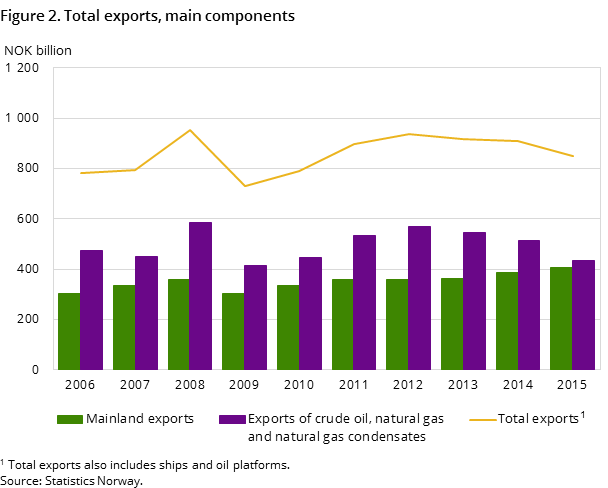
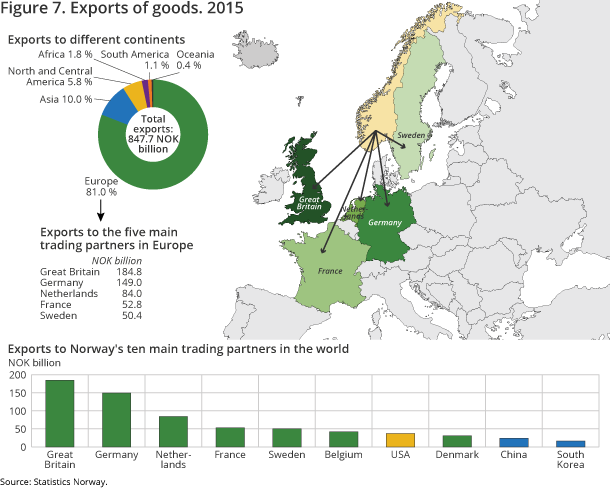
In parallel with the drop in oil price, the Norwegian krone weakened against major international currencies. This has increased the value of Norwegian exports, but at the same time made Norwegian imports more expensive. This effect manifests itself in mainland exports, which rose by 5.1 per cent in 2014 and amounted to NOK 406.2 billion in 2015. Natural gas exports increased in contrast to the dramatic drop in oil exports. Exports of natural gas amounted to NOK 227.9 billion in 2015; 1.9 per cent more than in 2014. The trade balance went down from NOK 347.7 billion in 2014 to NOK 233.7 billion in 2015; a decline of NOK 114 billion. The sharp fall in the trade surplus is caused by both lower exports and an increase in imports.
Sharp decline in the export value of crude oil
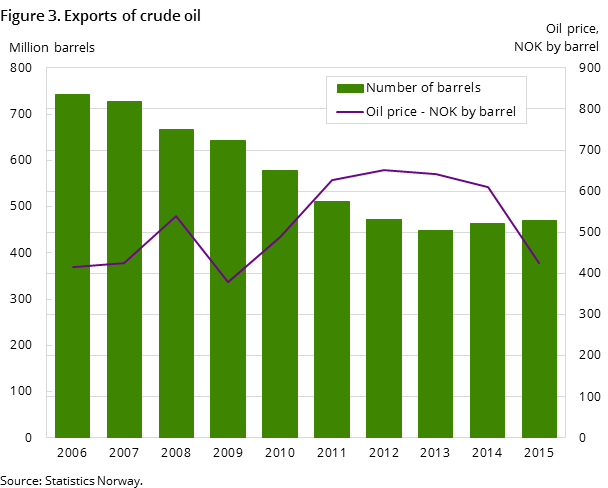
Exports of oil amounted to almost NOK 200 billion in 2015. This represents a decline of almost NOK 83 billion compared with 2014, or nearly 30 per cent. The fall was due to lower crude oil prices. The average price of crude oil in 2014 was NOK 610 per barrel but fell to NOK 425 per barrel in 2015. This is a decline of more than 30 per cent. The decline in exports would have been even steeper if it were not for the depreciation of the Norwegian krone. Norwegian crude oil is sold in foreign currencies, which means that when the value of oil is calculated back into Norwegian kroner some of the loss from lower oil prices is offset by the increased gain on a weaker krone. According to figures from the US Energy Information Agency, the price of Brent spot price measured in USD fell by 66 per cent from June 2014 to December 2015. Meanwhile, according to our figures (measured in Norwegian kroner), the price has fallen by just over 50 per cent during the same period. The disparity is due to the currency effect.
The number of exported barrels increased from just over 463 million barrels to almost 471 million barrels from 2014 to 2015; an increase of 1.6 per cent compared with last year.
The export value of natural gas higher than for oil
Exports of natural gas increased from NOK 223.6 billion in 2014 to almost NOK 228 billion in 2015. This represents an increase of 1.9 per cent. The export value of natural gas is now higher than crude oil exports. Exports of gas in a gaseous state increased from 102.3 billion standard cubic metres in 2014 to 109.5 billion standard cubic metres in 2015. This represents an increase of 7 per cent.
Increased mainland exports
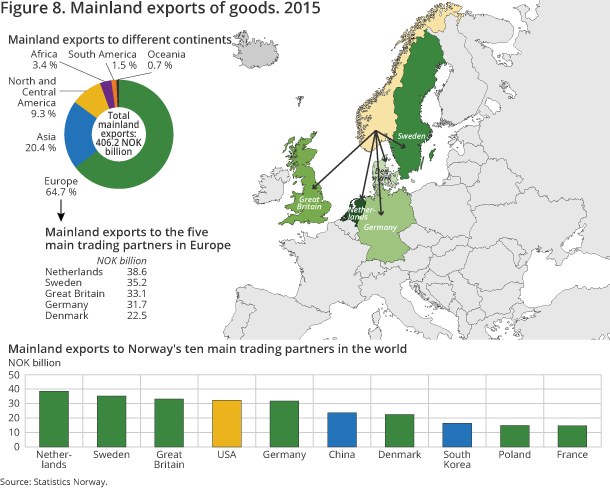
Exports of mainland goods increased from NOK 386.7 billion in 2014 to NOK 406.2 billion in 2015 - an increase of 5.1 per cent. Apart from mineral fuels, lubricants and related materials, exports increased in all commodity groups from 2014 to 2015.
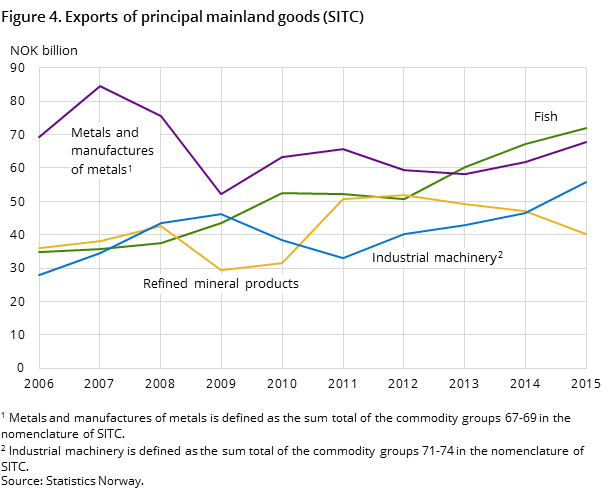
The biggest increase came in the main commodity group machinery and transport equipment. Here, the value rose by 16.3 per cent, from NOK 86.1 billion in 2014 to NOK 100.1 billion in 2015. All subgroups increased, but general industrial machinery and equipment went up most, by 20 per cent, to NOK 25.9 billion. Otherwise, exports of manufactured goods and chemical products rose by NOK 6.7 billion and NOK 6.2 billion to NOK 77.7 billion and NOK 51.7 billion. The largest subgroup in manufactured goods is non-ferrous metals, which includes aluminium. Within this category, goods at a value of NOK 43.4 billion where shipped abroad; 7.1 per cent more than in 2014. The commodity item with most exports is unwrought primary aluminium alloys. For this commodity, goods at a value of NOK 20.1 billion were exported; an increase of 5.5 per cent. This increase comes despite the fact that the quantity decreased by 9.6 per cent to 1.1 million tonnes in 2015.
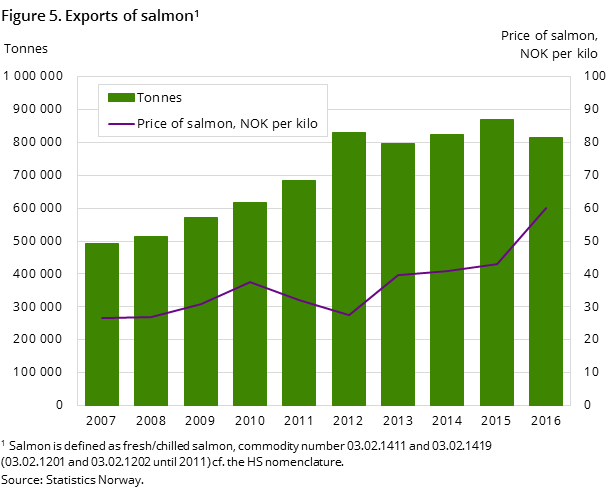
Exports of fish amounted to NOK 72 billion in 2015; an increase of 7.3 per cent compared with the previous year. The three types of fish with most exports were salmon (NOK 47.6 billion), cod (NOK 7.9 billion) and mackerel (NOK 3.8 billion). Together, the value of these types of fish accounts for more than 80 per cent of fish exports.
Exports of liquefied propane and butane fell by 38.8 per cent from 2014 to 2015 and amounted to NOK 11.7 billion in 2015. Volume remained fairly stable, with a slight decrease of 0.5 per cent. This means that prices have weakened considerably through 2015. Refined petroleum products saw a decline in export value of 14.7 per cent to NOK 40.3 billion in 2015.
A weak exchange rate made imports record high
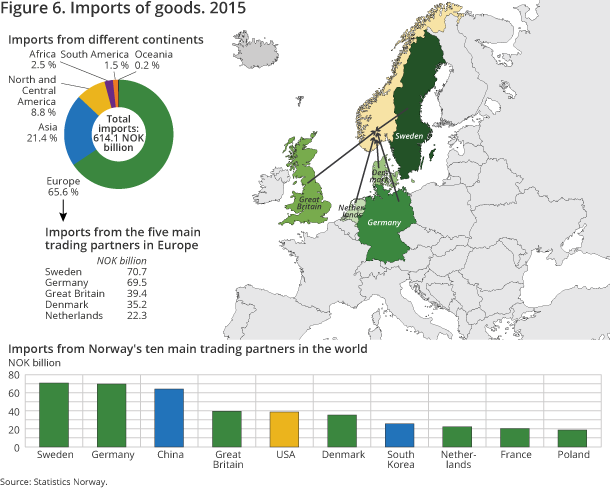
In 2015, we imported goods worth a record high NOK 614.1 billion. This is a value increase of 9.5 per cent from 2014.
However, the exchange rate plays a major role. The import-weighted krone exchange rate at Norges bank - I-44, shows that the foreign currency is 10.5 per cent more expensive in 2015 than in 2014.
By far the highest share of imports is the main commodity group machinery and transport equipment, where the value totalled NOK 248.3 billion - an increase of NOK 28.5 billion - or 13.0 per cent from the previous year.
The import value of the commodity group other transport equipment rose by NOK 13.9 billion, ending at NOK 42.2 billion – double that of the previous year. Here the import of an oil platform amounting to NOK 16.7 billion was a large contributor. The oil platform was from South Korea, and contributed to half of the increase in imports from Asia in 2015.
Passenger car imports ended at NOK 39.5 billion, with about 201 000 cars being imported; more than 8 000 more than the year before, and almost the same as in 2013. In 2015, the average car was 8.7 per cent more expensive than in 2014. Many electric cars were also imported in 2015 - about 32 000, at a value of NOK 7.8 billion. Thus, around 19.7 per cent of the total car import was made up of electrical cars. On the other hand, second-hand car imports were down by more than 8 000 cars. And with a decline in the value of more than NOK 1.1 billion this import ended at NOK 3.8 billion in 2015. This is explained by the weaker exchange rates that affect this import. New cars are so far only adjusted for inflation.
With regard to industrial machines, the increase in imports for commodity groups in SITC 71-74 was from NOK 67.0 billion to NOK 71.8 billion in 2015. Engines and equipment increased by NOK 1.5 billion, and machinery specialised for particular industries rose by NOK 2.6 billion. The exchange rate also affects these figures. Oil investments were down in 2015, and the import share of such investments is quite high. Investment in some mainland industries has also declined. This has a negative impact on the imported quantity of machines.
Imports of metalliferous ores; an important product in the metal industry, rose by NOK 1.1 billion or 5.1 per cent, to NOK 21.7 billion from 2014 to 2015. The importerd quantity increased by 7.9 per cent ending at 4.7 thousand tonnes, however the price fell marginally.
Steadily increasing imports of mobile phones
In 2015, we imported consumer goods such as clothing worth NOK 19.4 billion; up 12.6 per cent, and footwear worth NOK 5.0 billion; up 16.0 per cent compared to 2014. Furniture imports totalled NOK14.9 billion; up 11.4 per cent compared to 2014.
Norwegians also imported more than 2.8 million mobile phones, which was an all time high of NOK 7.8 billion. The number of phones was higher in 2013, when the import was almost 2.9 million phones. Fewer computers and tablets were imported in 2015; less than 1.5 million at a value of NOK 6.0 billion. The demand for tablets decreased in 2015 for various reasons.
Increased exports to Europe – decrease to Russia
Mainland exports to EU countries increased by NOK 6.9 billion from 2014 to 2015; up from NOK 239.9 billion to NOK 246.8 billion. Of these countries, the Netherlands, Sweden and Great Britain received the most. These countries imported Norwegian goods worth a total of NOK 106.8 billion in 2015 - a decrease of 0.8 per cent compared with 2014. Exports to the three largest countries account for about one quarter of the total Norwegian mainland exports.
Exports to Russia fell by a third and amounted to NOK 1.7 billion in 2015 compared with NOK 5.2 billion in 2014. This is the first time the entire year has been affected by Russian sanctions on seafood, and this explains much of the decline.
Highest nominal trade ever with USA
The USA was the fourth largest recipient of Norwegian exports in 2015, receiving goods worth NOK 32.2 billion in 2015, compared to NOK 27.9 billion in 2014. Exports for 2015 are the highest ever measured here. The commodity groups machinery and transport equipment as well as fish increased the most. Machinery and transport equipment experienced several large shipments in 2015, and the export of fresh whole salmon to the USA increased by 7.6 tonnes in 2014, ending at 15.6 tonnes. The strong US dollar has also pulled up the value of exports.
China now the sixth largest recipient of mainland goods
For the first time ever, China is the sixth largest recipient of Norwegian mainland goods, with a total value of NOK 23.7 billion. With an increase of 17.7 per cent in 2014, China overtook Denmark’s position as the sixth largest recipient of goods from Norway.
Trade with the BRICS countries
As mentioned, exports to Russia fell and exports to China were up. With regard to imports - Russia and China were both higher in 2015 than the year before, measured in nominal NOK. Imports from China ended at NOK 64.0 billion - up 20.4 per cent. From Russia, a growth of 12.7 per cent meant total imports of NOK 11.2 billion. From Brazil, there was an increase of NOK 2.2 billion - or 27 per cent. Imports from India increased from NOK 2.8 billion to NOK 3.2 billion, while imports from South Africa were nearly unchanged. From Russia, imports of mineral fuels increased by NOK 2.6 billion, while imports of non-ferrous metals and steel decreased by NOK 1.8 billion. From China, imports of clothing and footwear were up NOK 1.5 billion, and imports of machinery and transport equipment, in which mobile phones and computers are also included, were up with NOK 5.5 billion.
This page has been discontinued, see External trade in goods, Monthly and External trade in goods, Annually.
Contact
-
Information services external trade
E-mail: utenrikshandel@ssb.no
-
Nina Rolsdorph
E-mail: nina.rolsdorph@ssb.no
tel.: (+47) 41 51 63 78
-
Jan Olav Rørhus
E-mail: jan.rorhus@ssb.no
tel.: (+47) 40 33 92 37
