Content
Published:
This is an archived release.
Stagnation in mainland exports
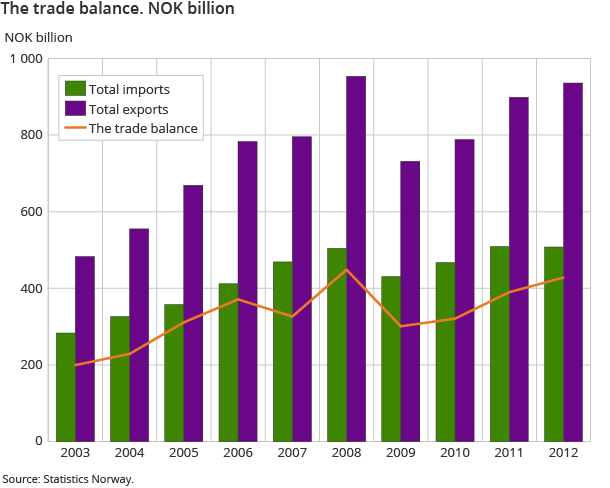
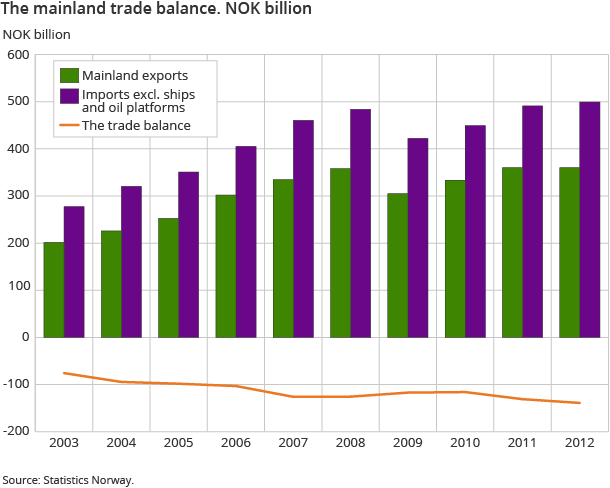
High oil prices and increased natural gas production resulted in large export revenues and increased trade surplus in 2012. Mainland exports, however, were unchanged. The deficit of the mainland trade balance was at a record high.
| NOK Million | Share in per cent | Change in per cent | |
|---|---|---|---|
| 2012 | 2012 | 2011 - 2012 | |
| Imports | 507 650 | 100.0 | -0.2 |
| Ships and oil platforms | 8 422 | 1.7 | -51.8 |
| Exports | 935 718 | 100.0 | 4.1 |
| Crude oil | 306 825 | 32.8 | -4.5 |
| Natural gas | 252 255 | 27.0 | 26.1 |
| Natural gas condensates | 10 779 | 1.2 | -2.2 |
| Ships and oil platforms | 5 729 | 0.6 | -6.3 |
| Mainland exports | 360 130 | 38.5 | 0.0 |
| The trade balance | 428 068 | . | 9.8 |
| The mainland trade balance | -139 098 | . | -6.1 |
Total exports of goods amounted to NOK 935.7 billion in 2012, up 4.1 per cent from 2011. Total imports amounted to NOK 507.7 billion; a decline of 0.2 per cent. The trade surplus ended at NOK 428.1 billion. Thus, profits continued to increase and reached the second highest level ever – NOK 20.6 billion lower than the record level before the financial crisis. The mainland trade balance did not experience the same positive trend, with a deficit of NOK 139.1 billion; the highest level ever.
The trade surplus with Europe, which is our main trade partner, was high when we include items such as oil and gas – NOK 431.9 billion. However, the mainland trade balance showed a different picture, with the deficit of NOK 100.9 billion at a record high and the same level as in 2009.
Increased total exports but mainland exports stagnated
Total exports rose by NOK 37.1 billion in 2012. Natural gas exports contributed to this and the export of crude oil fell by 4.5 per cent. Mainland exports have increased in the years following the financial crisis, but showed no increase in 2012. However, there were differences between the various groups, with an increase in machine exports and decrease in metal and fish exports.
Volume and price indices for foreign trade, which give a decomposition of export figures in volume and price, showed that total exports (total exports excluding ships and oil platforms in these statistics) increased both in price and volume from 2011 to 2012. The changes were 3.3 and 0.2 per cent respectively. Mainland exports also showed an increase in volume of 1.7 per cent, but prices fell by 1.6 per cent. This is the first general fall in prices since 2009, and is partly explained by the declining prices of fish and metals.
The distribution of mainland exports, however, shows no clear trend in exports from Europe to Asia in the years following the financial crisis. Apart from 2011, Europe had a larger share of total mainland exports and Asia had a lower percentage in 2012 than in 2009 and 2010.
Oil exports declined despite higher price
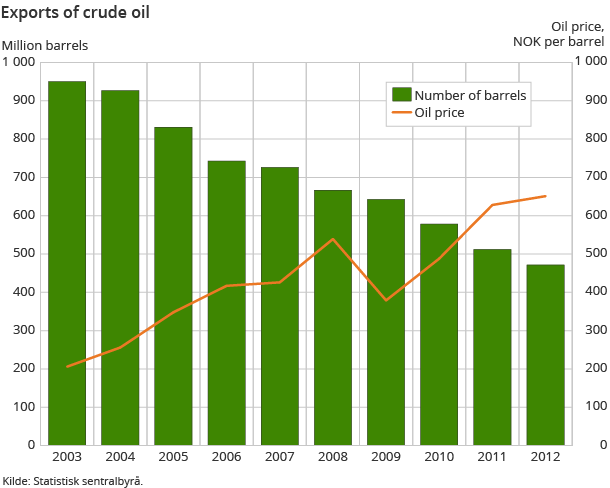
In 2012, Norway exported crude oil worth NOK 306.8 billion. This was a decrease of NOK 14.4 billion or 4.5 per cent compared to 2011. Turbulence in Syria and Sudan, and uncertainty in China and the U.S. economy contributed to oil price fluctuations through 2012.
The average oil price measured in NOK ended at NOK 651 per barrel; up NOK 23 from 2011. The reduced amount is thus the reason behind the lower income. The number of barrels exported fell by 40.3 million.
Natural gas exports compensated by strong growth
2012 was a record year for natural gas exports, with the Norwegian gas export totalling NOK 252.3 billion - up 26.1 per cent from 2011. The exported quantity of natural gas, in a gaseous state, saw a substantial 13.5 per cent increase from 96.5 million Sm3 (standard cubic metres) in 2011 to 109.5 Sm3 in 2012. The price of natural gas was also slightly higher. Growth was distributed to all recipient countries, with the highest growth to the UK - with 5.3 million Sm3.
Distribution of exports between the continents
Mainland exports increased to all continents in 2012 with the exception of Europe and North and Central America. For these continents, the mainland export value fell by 2 and 7.2 per cent respectively compared to 2011. Exports to Asia increased from NOK 52.2 billion to NOK 58.2 billion; up 11.5 per cent.
Increased exports of industrial machinery and scientific instruments
Unlike the previous two years, exports of industrial machinery increased in 2012. Exports of general industrial machinery and machinery specialised for particular industries in total amounted to NOK 32.3 billion in 2012; an increase of NOK 6 billion, or more than 23 per cent, since the previous year. Eighty-five per cent of the export went to European and Asian countries - almost equally shared between the two continents. Exports to Europe increased in 2012 and ended at NOK 14.2 billion. Exports of industrial machinery to Asia also rose in 2012 after two years of decline, however the 2012 export value was still below the value in 2010.
The export of scientific and technical instruments has risen in the last 3 years. The commodity group instruments for measurement and analysis accounted for most of the increase, rising from NOK 8.6 billion in 2011 to NOK 10.4 billion in 2012.
Decline for metals and chemical products
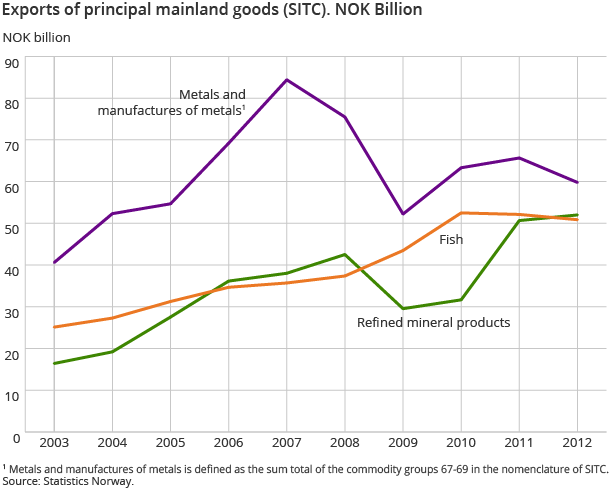
The largest drop in exports was for manufactured goods. Export value came to NOK 69.1 billion in 2012, which is NOK 7.4 billion lower than the year before. The decline in the group non-ferrous metals was a determining factor, and exports of aluminium and nickel, which increased in both 2010 and 2011, fell by around NOK 6.3 billion. The decrease was caused both by lower prices as well as reduced export volumes. Also among manufactured goods, exports of paper and paperboard dropped by more than 21 per cent, from NOK 6.2 billion in 2011 to NOK 4.9 in 2012.
The main commodity group chemical products, which had a growth in both previous years, fell by more than NOK 5 billion and totalled NOK 40.7 billion in 2012. Most of the decline can be attributed to the decrease in the solar industry.
Lower export prices for fish
Despite exported volumes of fish (crustaceans and molluscs) rising by 108 000 tonnes compared to 2011, the export value dropped by NOK 1.3 billion and totalled NOK 50.8 billion.
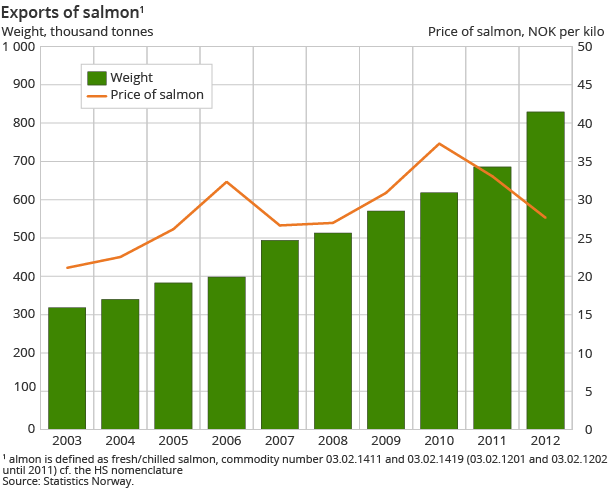
Prices were generally lower for most species in 2012 compared to the previous year. Fresh and chilled whole salmon saw a particularly large fall, with an average of NOK 4.30 per kg lower than in 2011. The 144-tonne increase in the exported volume of salmon in 2012 pushed up the export value by NOK 1 billion. The decline in value for cod and mackerel, however, decreased by NOK 543 million and NOK 585 million respectively compared to 2011. This was despite an increase in exported volumes of both species. The export price for herring was somewhat higher than in 2011, but the value of herring exports fell due to an almost 18 per cent fall in the export volume.
Europe is the main export partner
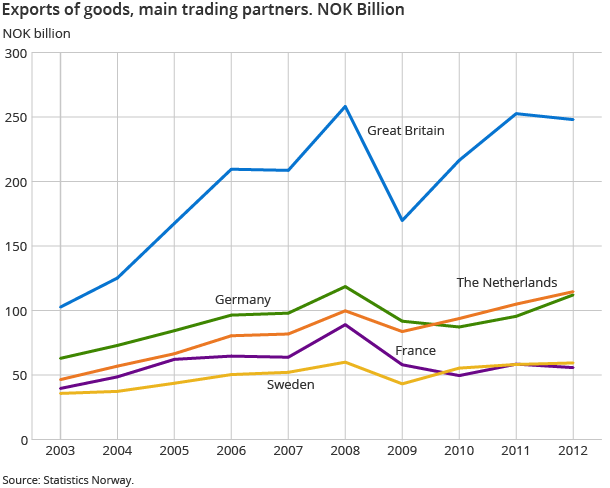
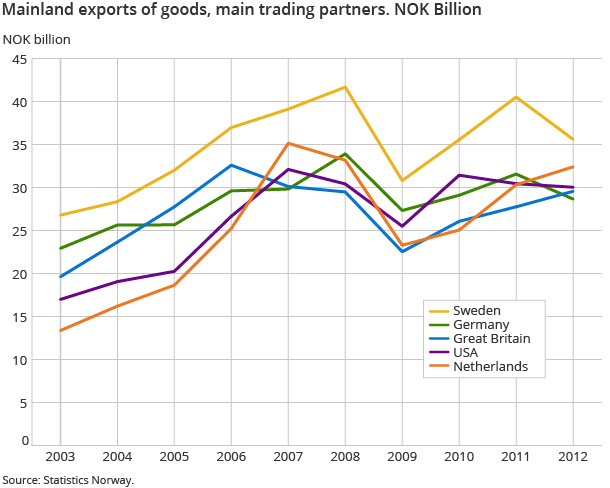
Sweden remains the largest recipient of Norwegian goods, however mainland exports to Sweden fell by almost NOK 5 billion compared to the previous year, amounting to NOK 35.6 billion in 2012. The commodity groups non-ferrous metals, electrical machinery and telecommunications equipment fell in particular.
Mainland exports to the Netherlands rose by NOK 2 billion. Refined petroleum products and electricity accounted for most of the increase. There was a decline of almost NOK 3 billion to Germany. The main drop was in the main commodity groups manufactured goods, machinery and transport equipment and chemical products.
Exports to countries affected by the financial crisis in southern Europe continued falling, as last year, for all countries except for Greece, where a large shipment of refined petroleum products increased the export value. Exports to Spain fell from NOK 7.3 to NOK 6.1 billion, to Italy from NOK 5.4 to NOK 4.6 billion and Portugal from NOK 3.4 to NOK 3 billion in 2012 compared to 2011.
Increase in mainland exports to Asia
Exports to South Korea increased by NOK 5.6 billion to around NOK 13 billion in 2012. The majority of the increase was found in the main commodity group machinery and transport equipment, and particularly in exports for general industrial machinery and machinery specialised for particular industries.
China remains our largest export partner in Asia. Mainland exports came to NOK 13.9 billion; NOK 1.4 billion less than in 2011. Exports of chemical products had the largest drop, but there was also a fall in the group machinery and transport equipment, especially for industrial machinery. Mainland exports to Japan also fell - by a total of NOK 1.9 billion. Chemical products accounted for more than half of the decline.
Fish exports to Japan and China were lower in 2012 than the year before. Exports to China fell by NOK 337 million to NOK 2.1 billion, while fish exports to Japan saw a much larger decline, from NOK 2.9 to NOK 2.2 billion - about NOK 700 million less than in 2011. For both countries, the main reason for the drop was lower exports of mackerel.
North and Central America
Mainland exports to North and Central America fell by NOK 2.8 billion and amounted to NOK 35.8 billion. A fall in the export of refined petroleum products to Canada is the main cause for the decline.
Weak growth in imports excluding ships and oil platforms
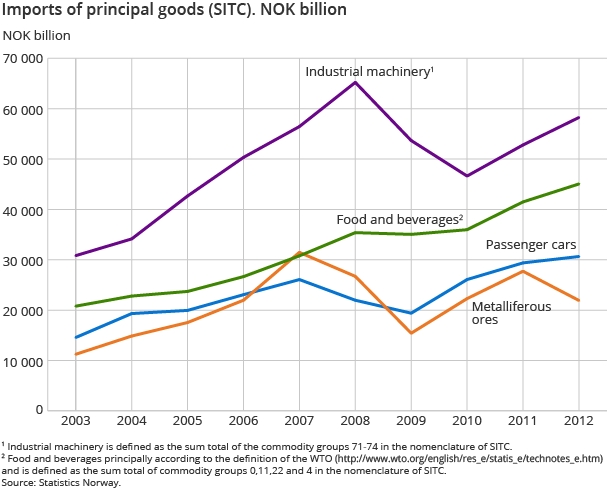
After a strong recovery in imports in 2009 and 2010, the import growth has levelled off in recent years. Total imports in 2012 were at the same level as in 2011; NOK 507.7 billion compared with NOK 508.6 billion in 2011. Excluding ships and oil platforms, there was still a slight increase in the total imports of 1.7 per cent or NOK 8.1 billion, ending at NOK 499 billion. Investments in the Norwegian Continental Shelf contributed to the growth in imports of industrial machinery. Imports of essential inputs in the Norwegian industry such as metalliferous ores and raw chemical materials, however, went down.
Weaker global economic conditions and an increasingly stronger NOK have pushed down import prices in recent years. In 2012, there was virtually no growth in import prices. Indices for external trade in goods showed an increase of 0.4 per cent. Volume increased somewhat more, by 1.3 per cent.
With an average value of NOK 7.47 in 2012, the euro rate was the highest since the euro's inception in 1999. The import-weighted krone exchange rate of Norges Bank (the central bank of Norway); I-44, also showed a record level for the exchange rate.
Norwegian imports - from different trading partners
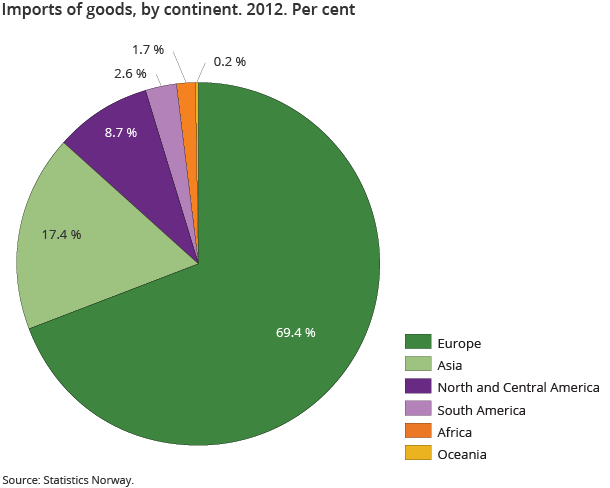
In 2012, Norway imported more from most parts of the world, except North and Central America and Africa.
Imports of goods, excluding ships and oil platforms, from European countries reached NOK 350.1 billion; an increase of 1.6 per cent. From 2011, imports from Asia also increased by almost 5 per cent, which is half that of the two previous years. Asian imports totalled NOK 82.2 billion in 2012. From North and Central America, imports amounted to NOK 44.1 billion in 2012; down NOK 6.3 billion from the previous year.
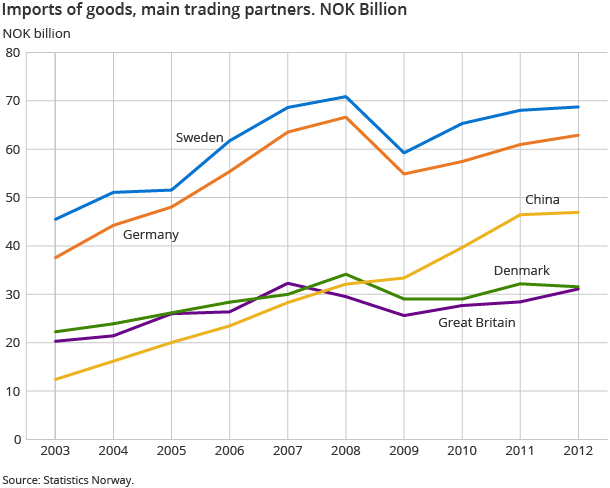
Sweden was our largest trading partner on the import side. From here we received items for NOK 68.7 billion in 2012. The value was slightly higher than the previous year. The main goods imported from our nearest neighbour were petroleum products and vehicles.
Our second largest trading partner on the import side was Germany. Compared with 2011, the German imports increased by 3.2 per cent. The import of cars was mainly responsible for the increase.
Norway imported 193 800 vehicles in total in 2012; 250 less than the year before. The average car was more expensive in 2012 than in 2011.
Imports from China levelled off in 2012
Our third largest import country was China, which is still considered to be a developing country. The import growth we have seen for Chinese goods in recent years levelled off in 2012. China is still dominant among the Asian countries, but the country is also characterised by economic change - like much of the rest of the world - with an emphasis on a sustainable and independent economy. Imports from China grew considerably less than has been normal for the last decade; by just NOK 492 million. This was somewhat affected by the trade of ships. The rise when excluding ships was NOK 2.4 billion or 5.6 per cent.
In 2012, we imported an increasing number of computers and telephony from China, in addition to various metal and mineral products, furniture and chemicals and related products. Imports of clothing and shoes however showed a negative trend in 2012 compared to previous years. At the same time, imports of the same goods from the new low-cost countries such as Vietnam, Cambodia, Indonesia and Malaysia in 2012 went up.
Imports from other developing countries
Imports of goods from developing countries increased to NOK 92.2 billion in 2012. This was NOK 4.1 billion or 4.6 per cent more than in 2011.
Of the other BRICS countries, which are developing countries, imports from Brazil increased by NOK 795 million and from India by NOK 298 million. Imports from South Africa decreased by NOK 176 million. Imports from LDCs (least developed countries) increased by NOK 345 million, mainly due to higher imports of crude oil from Equatorial Guinea.
In 2012, imports from countries with preferential treatment (according to the GSP agreement) increased by NOK 2.7 billion, reaching NOK 80.4 billion in total. Imports subject to customs duty for ordinary GSP countries amounted to NOK 12.3 billion, while for LDCs the corresponding increase was NOK 1.7 billion. The degree of utilisation of the LDCs was 92.8 per cent, compared to 91.0 per cent for the ordinary GSP countries in 2012.
Contact
-
Information services external trade
E-mail: utenrikshandel@ssb.no
-
Nina Rolsdorph
E-mail: nina.rolsdorph@ssb.no
tel.: (+47) 41 51 63 78
-
Jan Olav Rørhus
E-mail: jan.rorhus@ssb.no
tel.: (+47) 40 33 92 37

