Content
Published:
This is an archived release.
Decline in oil exports
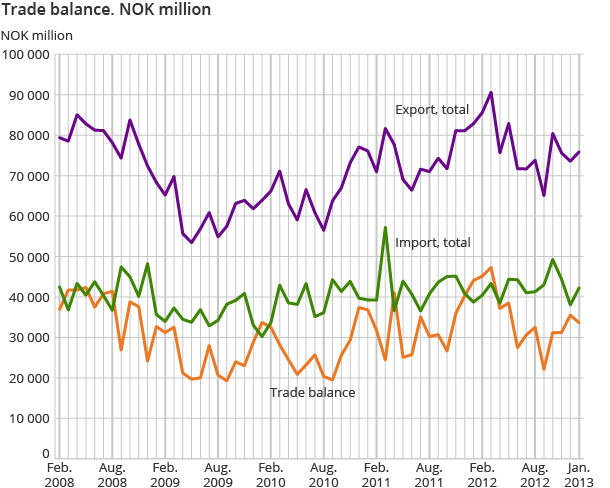
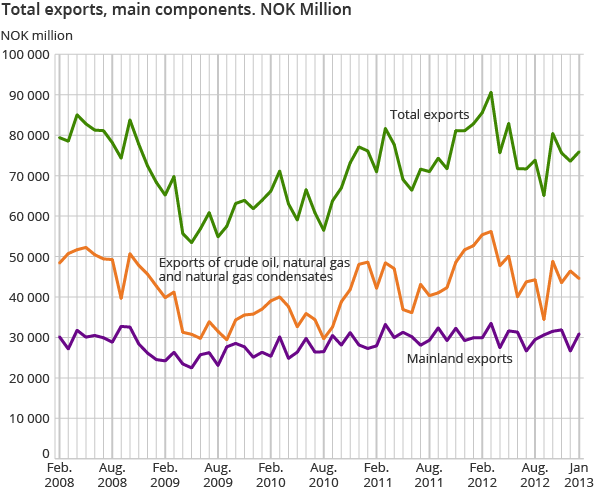
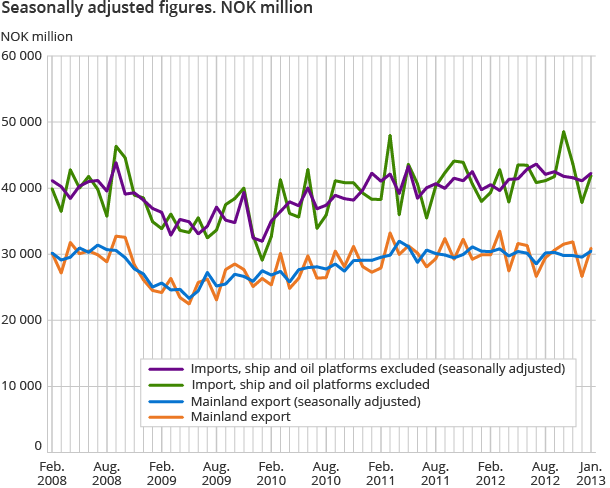
In January, the export of natural gas was higher than oil exports. In total, exports of goods came to NOK 75.5 billion, down 8.6 per cent compared to January 2012. Imports increased by 10.4 per cent, totalling NOK 41.9 billion.
| January | Change in per cent | ||
|---|---|---|---|
| 2012 | 2013 | ||
| 1 Imports | 37 987 | 41 931 | 10.4 |
| 2 Exports | 82 598 | 75 469 | -8.6 |
| Of which | |||
| Crude oil | 26 669 | 21 090 | -20.9 |
| Natural gas | 25 053 | 22 265 | -11.1 |
| Condensates | 965.0 | 1 207 | 25.1 |
| 3 Exports excl. crude oil, natural gas and condensates | 29 912 | 30 907 | 3.3 |
| 4 Trade balance (2-1) | 44 611 | 33 538 | -24.8 |
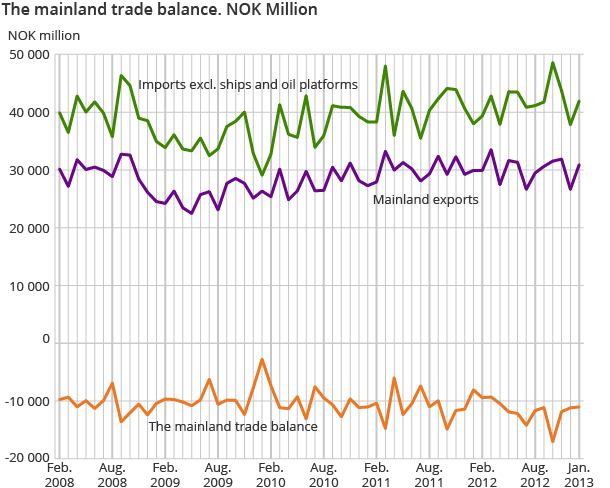
| 5 Trade balance excl. oil, natural gas and condensates (3-1) | -8 075 | -11 025 | . |
The trade surplus ended at NOK 33.5 billion, and dropped NOK 11.1 billion or 24.8 per cent compared to January 2012. The decline was mainly due to lower exports of crude oil, a drop in natural gas exports and an increase in imports of machinery, transport equipment and refined petroleum products.
Lower exports of crude oil
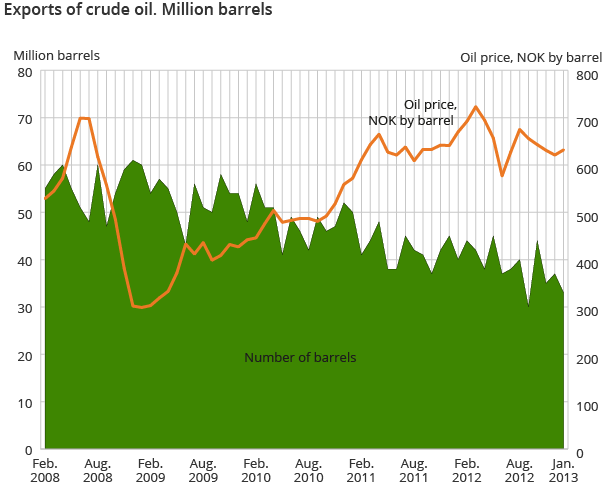
The export value of crude oil amounted to NOK 21.1 billion in January 2013, down 20.9 per cent, or NOK 5.6 billion compared to oil exports in January 2012. The decrease was mainly due to lower export volumes, with technical problems and partial shutdowns in some of the oil fields as contributing factors. Moreover, a stronger Norwegian currency against the US dollar led to a drop in prices. A total of 33.4 million barrels were exported; 6.4 million less than in January 2012. The average price per barrel of crude oil was NOK 632; down NOK 38 compared to January 2012, but up NOK 11 from December 2012.
Decline in exports of natural gas
In January, natural gas exports came to NOK 22.3 billion; down NOK 2.8 billion, or 11.1 per cent compared to January 2012. The exported volume of natural gas in a gaseous state amounted to 10.1 billion cubic metres. This was 286 million less than January 2012.
All time high salmon exports
Mainland exports amounted to NOK 30.9 billion in January 2013; an increase of 3.3 per cent, or NOK 1 billion compared to January 2012.
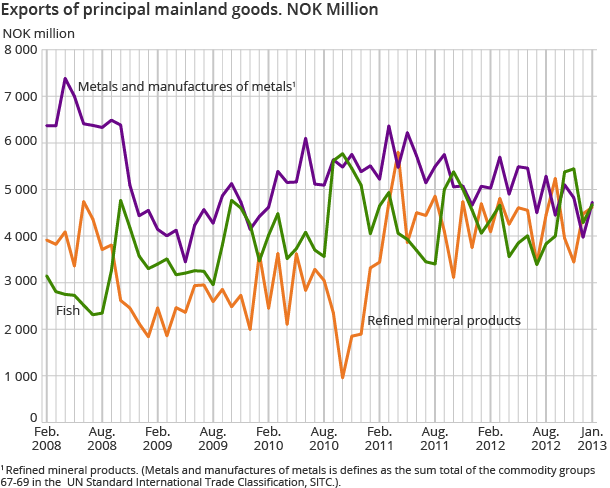
Fish exports went up NOK 616 million, ending at NOK 4.7 billion. The increase was due to an all time high salmon export in January. Export values of fresh whole salmon increased by NOK 780 million, ending at NOK 2.2 billion.
Increase in exports of machinery
The largest increase was in the main group machinery and transport equipment, which went up NOK 955 million, ending at NOK 5.8 billion. Within this group, electrical machinery, apparatus and appliances went up NOK 642 million, while general industrial machinery and equipment increased by NOK 425 million.
As in previous months, exports of non-ferrous metals went down. This is mainly due to reductions in aluminium exports. Overall, the group dropped NOK 493 million and amounted to NOK 3.1 billion.
Rise in imports of machinery, transport equipment and refined petroleum products
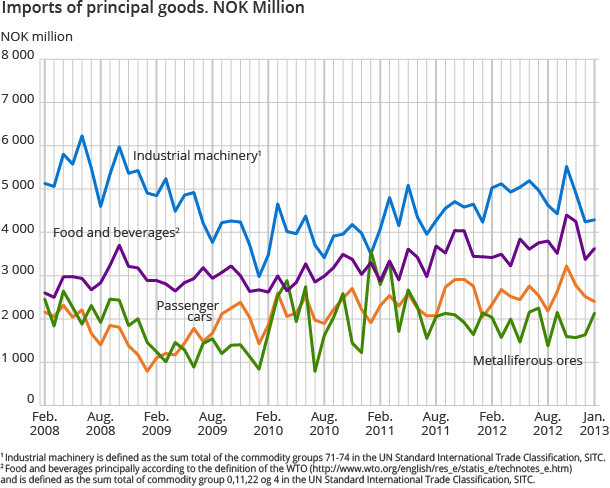
Imports of goods excluding ships and oil platforms came to NOK 41.9 billion; an increase of 10.4 per cent, or NOK 3.9 billion compared to January 2012.
The largest increase was in the main group machinery and transport equipment, which went up NOK 11.8 per cent, ending at NOK 15.3 billion. Within this group, other transport equipment more than doubled from NOK 804 million in January 2012 to NOK 1.8 billion in January 2013. The sub-group office machines and automatic data processing equipment rose by NOK 254 million and amounted to NOK 1.6 billion. This was due to higher imports of laptops and tablets.
Imports of refined mineral petroleum products went up NOK 1 billion, and came to NOK 2.3 billion. Furthermore, imports of electric current tripled, totalling NOK 298 million, while organic chemicals went up NOK 298 million, ending at NOK 756 million.
Contact
-
Information services external trade
E-mail: utenrikshandel@ssb.no
-
Nina Rolsdorph
E-mail: nina.rolsdorph@ssb.no
tel.: (+47) 41 51 63 78
-
Jan Olav Rørhus
E-mail: jan.rorhus@ssb.no
tel.: (+47) 40 33 92 37

