Content
Published:
This is an archived release.
Record trade surplus
The trade surplus in January 2014 ended at NOK 48.8 billion – the highest ever recorded for a single month. Exports amounted to NOK 90.2 billion in January, while imports ended at NOK 41.4 billion. This is an increase from January 2013 of 16.5 per cent and a decrease of 3.8 per cent respectively.
| NOK Million | Change in per cent | ||
|---|---|---|---|
| January 2014 | December 2013 - January 2014 | January 2013 - January 2014 | |
| 1The figures are marked with the symbol *. This is Statistics Norways standard symbol for indicating preliminary figures. | |||
| 2Due to the data collection method, the preliminary monthly figures published for ships and oil platforms are often incomplete. In retrospect, therefore, the trade in these goods could in some cases lead to major corrections in the figures. Please see tables 2-4 for the impact these figures have on the external trade. | |||
| The corrections are in the design of the tables, the figures are unchanged. 19 February 2014. | |||
| Imports | 41 390 | -9.9 | -3.8 |
| Imports of ships and oil platforms2 | 274 | -79.5 | -73.0 |
| Exports | 90 178 | 13.7 | 16.5 |
| Crude oil | 29 112 | 8.6 | 38.0 |
| Natural gas | 24 794 | 8.7 | 4.2 |
| Natural gas condensates | 584 | 2.7 | -53.4 |
| Ships and oil platforms2 | 1 747 | 126.9 | 297.0 |
| Mainland exports | 33 941 | 19.6 | 10.1 |
| The trade balance | 48 788 | 46.0 | 41.8 |
| The mainland trade balance | -7 174 | -55.7 | -35.7 |
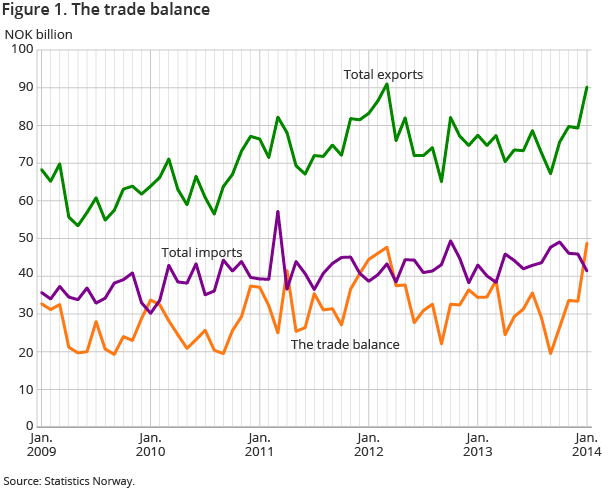
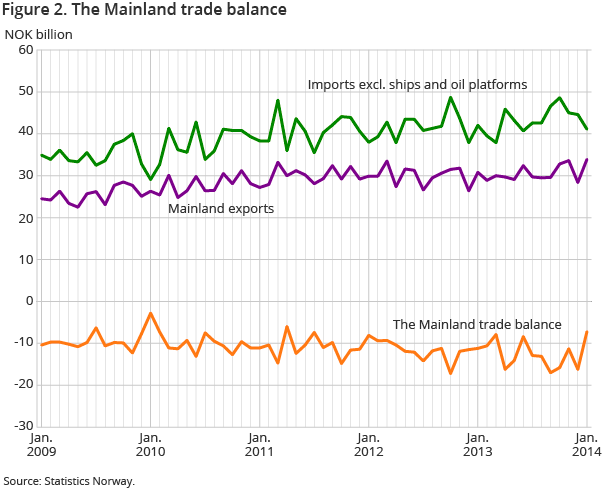
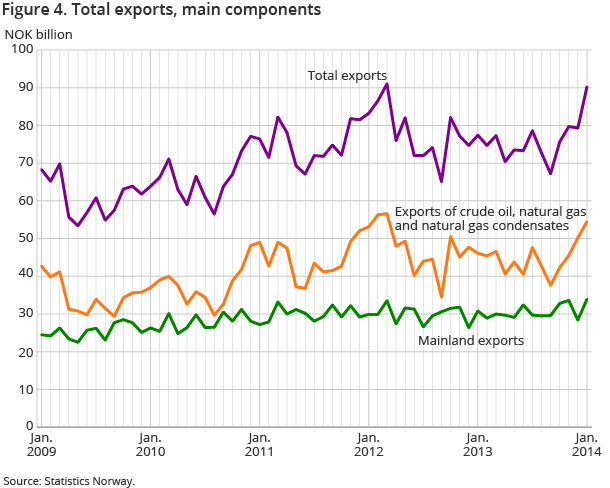
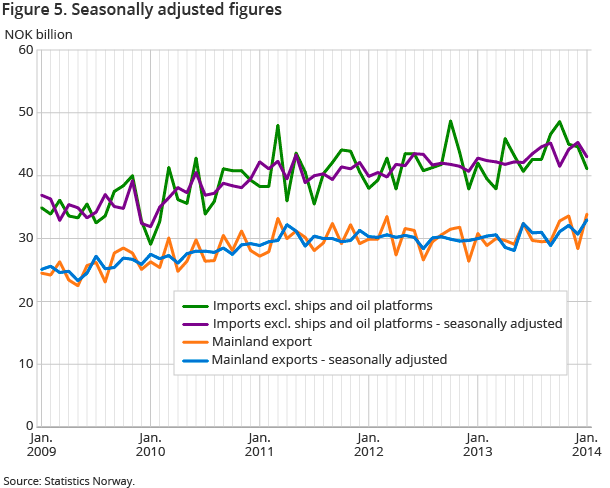
In January 2014, exports rose by NOK 12.8 billion compared to the corresponding month last year, and ended at NOK 90.2 billion. The large growth in exports was caused by high exports of oil and gas combined with a leap in the export of mainland goods. Export of mainland goods amounted to NOK 33.9 billion in the first month of 2014, which is a new record.
Increased price and quantity for oil
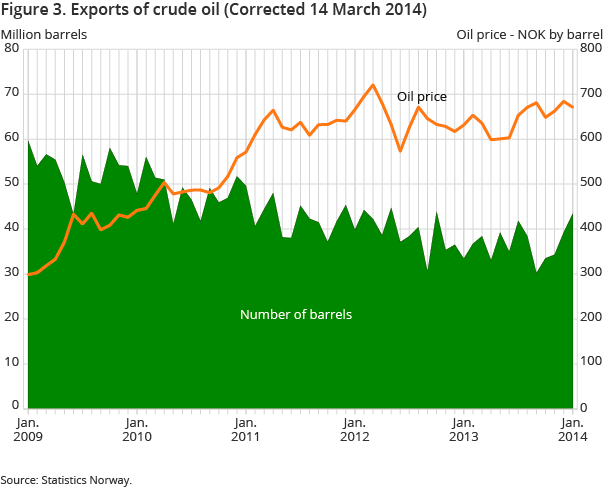
The value of oil exports amounted to NOK 29.1 billion in January 2014. This is an increase of NOK 8 billion compared to the corresponding month the previous year. The increase is caused both by higher price and quantity. The oil price increased from NOK 632 per barrel in January 2013 to NOK 671 per barrel this year. This constitutes an increase of NOK 39. To a large degree, this increase is caused by the weakening of the Norwegian krone. A total of 43.4 million barrels of crude oil were exported this January compared to 33.4 million barrels in January 2013. This is an increase of almost 30 per cent, and the highest level since October 2012.
Small change in exports of gas
The value of gas exports amounted to NOK 24.8 billion in January 2014. This is a marginal decrease from January 2013 when gas exports amounted to NOK 22.7 billion. A total of 9.4 billion standard cubic metres of gas in a gaseous state were exported during January 2014 - 764 million less than the corresponding month in 2013.
Large increase in fish exports
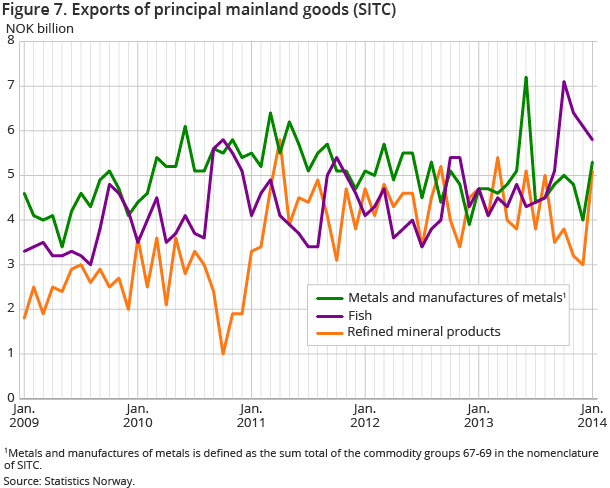
Mainland exports amounted to NOK 33.9 billion in January 2014. In comparison, the mainland exports in 2013 amounted to NOK 30.8 billion.
Fish to the value of NOK 5.8 billion were exported during the first month of 2014, compared to NOK 4.7 billion in 2013. This is an increase of 24.2 per cent. The increase is mainly due to higher exports of fresh salmon, which rose by NOK 846 million to NOK 3.0 billion from January 2013 to January 2014. The increased value of salmon exports is due to the higher price of salmon. From January 2013 to January 2014, the price of salmon rose by 40 per cent, from NOK 35 to NOK 49.
Most of the main commodity groups had a distinct increase in export value this month compared to January 2013. The largest rise is found among 'machinery and transport equipment', which increased from NOK 6.2 billion to NOK 7.9 billion. This is an increase of over 28 per cent. Most of the increase is due to higher exports of 'other transport equipment', which in turn is due to several ships being exported in January.
Another commodity group with a large increase was 'manufactured goods'. Exports within this group amounted to NOK 6.1 billion; an increase NOK 647 million compared to January 2013. The increase among the sub-groups 'manufactures of metals' and 'metals' was particularly strong. These groups increased by NOK 127 million and NOK 414 million respectively.
Lower imports
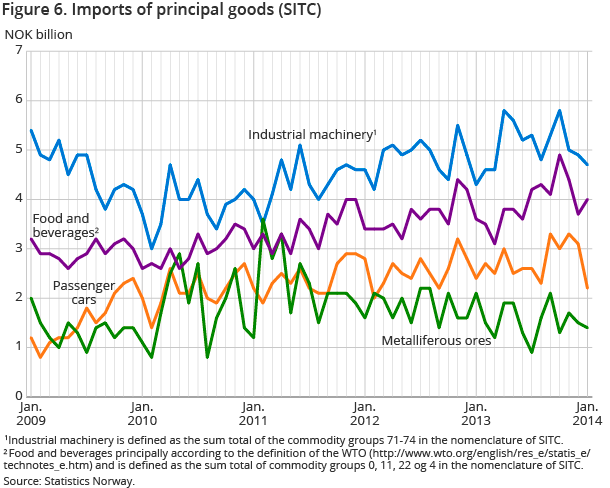
Imports amounted to NOK 41.4 billion in January 2014, which is a decrease of NOK 1.6 billion from January 2013. The decline was largest within the main commodity groups 'machinery and transport equipment' and 'inedible crude materials'. These categories fell by NOK 1.4 billion and NOK 733 million respectively and amounted to NOK 15.1 billion and NOK 2.3 billion. For 'machinery and transport equipment', the sub-groups 'other transport equipment' and 'road vehicles' pulled down the most. These groups decreased by NOK 1.9 billion and NOK 112 million respectively.
The main commodity groups 'miscellaneous manufactured articles' and 'manufactured goods' amounted to NOK 6.7 billion and NOK 6.6 billion respectively. These commodity groups increased by NOK 218 and NOK 907 million respectively. Most of the sub-groups of 'manufactured goods' rose and led to a broad increase. Especially significant was the increase in 'the manufactures of metals', and 'metals'. These groups increased by NOK 398 million and NOK 332 million respectively.
Contact
-
Information services external trade
E-mail: utenrikshandel@ssb.no
-
Nina Rolsdorph
E-mail: nina.rolsdorph@ssb.no
tel.: (+47) 41 51 63 78
-
Jan Olav Rørhus
E-mail: jan.rorhus@ssb.no
tel.: (+47) 40 33 92 37
