Content
Published:
This is an archived release.
Trade balance down
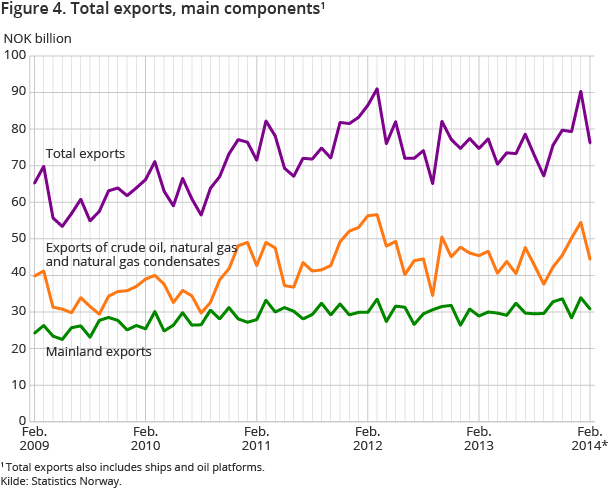
The trade surplus amounted to NOK 33.1 billion in February 2014, which was NOK 1.4 billion less than in February 2013. Export of goods totalled NOK 76.1 billion – up 2 per cent from last year. Imports rose by 7.2 per cent in February and came to NOK 43 billion.
| NOK Million | Change in per cent | NOK Million - so far this year | Change in per cent - so far this year | ||
|---|---|---|---|---|---|
| February 2014 | January 2014 - February 2014 | February 2013 - February 2014 | February 2014 | February 2013 - February 2014 | |
| 1The figures are marked with the symbol *. This is Statistics Norways standard symbol for indicating preliminary figures. | |||||
| 2Due to the data collection method, the preliminary monthly figures published for ships and oil platforms are often incomplete. In retrospect, therefore, the trade in these goods could in some cases lead to major corrections in the figures. Please see tables 2-4 for the impact these figures have on the external trade. | |||||
| Imports | 43 031 | 2.9 | 7.2 | 84 866 | 2.1 |
| Ships and oil platforms2 | - | -100.0 | -100.0 | 388 | -76.8 |
| Exports | 76 150 | -15.7 | 2.0 | 166 499 | 9.5 |
| Crude oil | 22 272 | -23.5 | -7.3 | 51 384 | 13.9 |
| Natural gas | 21 004 | -15.3 | 0.6 | 45 798 | 2.6 |
| Natural gas condensates | 1 085 | 85.7 | 133.0 | 1 669 | -2.9 |
| Ships and oil platforms2 | 994 | -49.0 | 139.5 | 2 942 | 244.1 |
| Mainland exports | 30 796 | -9.2 | 6.6 | 64 706 | 8.3 |
| The trade balance | 33 120 | -31.7 | -4.1 | 81 633 | 18.4 |
| The mainland trade balance | -12 235 | -62.3 | -15.5 | -19 772 | 9.1 |
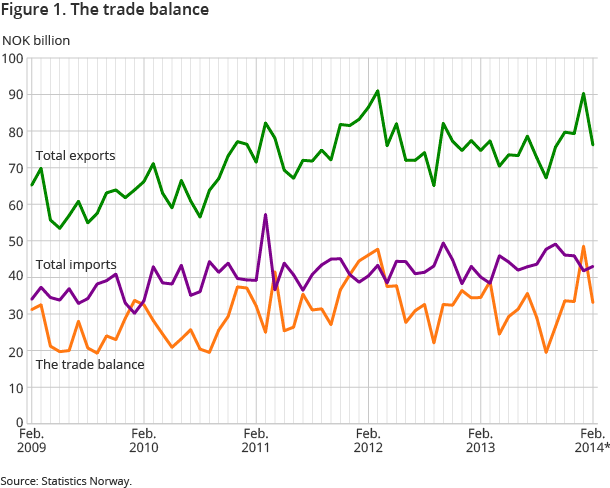
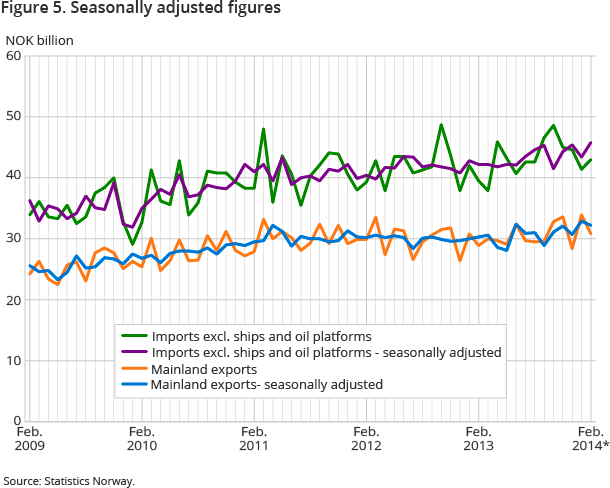
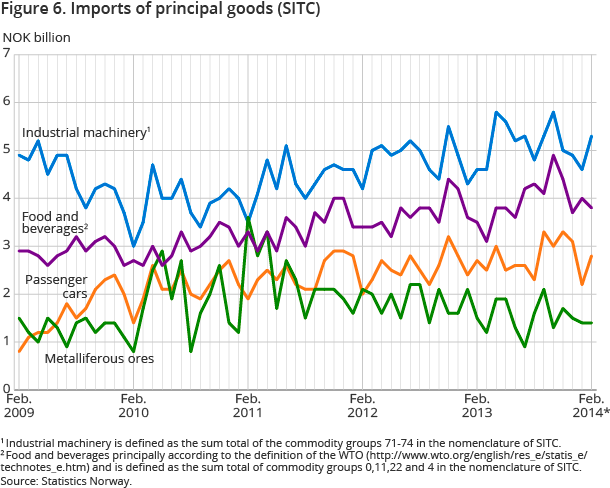
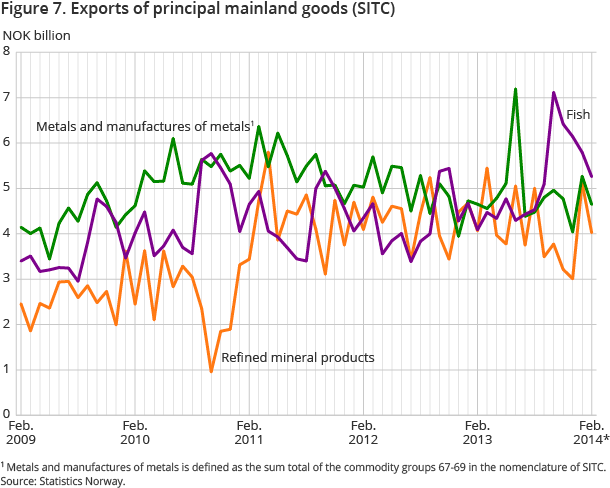
In February, the value of imports increased more than exports, which led to a decline in trade surplus compared to the same month one year ago. The largest increase in imports was in the main categories Manufactured goods and Food. The value of exported fish rose by NOK 1.2 billion, while exports of crude oil dropped by over NOK 1.7 billion compared to February 2013.
Minor changes in oil exports
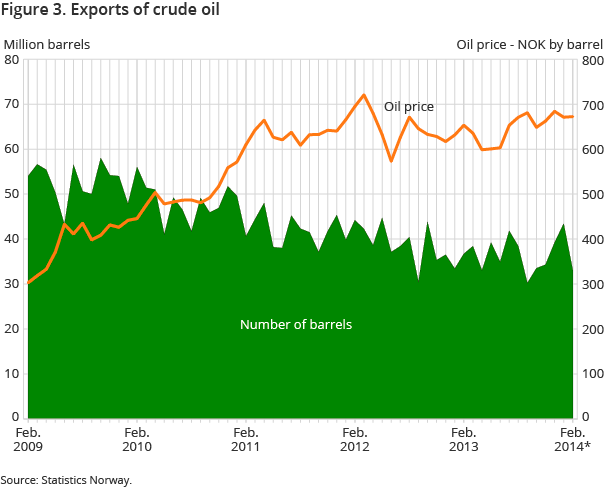
Crude oil exports totalled almost NOK 22.3 billion in February, compared to NOK 24.0 billion a year earlier. A total of 33.1 million barrels of oil were exported; a decline of about 10 per cent. The decline was in spite of a lower volume of exports partly due to the stronger USD compared to NOK. The price per barrel was NOK 673 in February compared to NOK 654 a year earlier.
Steady exports of natural gas
The value of exported gas in a gaseous state came to NOK 19.9 billion in February, compared to NOK 19.7 billion last year. In February, exports amounted to 8.7 billion standard m3 of natural gas, which is a slightly higher volume than last year.
Increased mainland exports
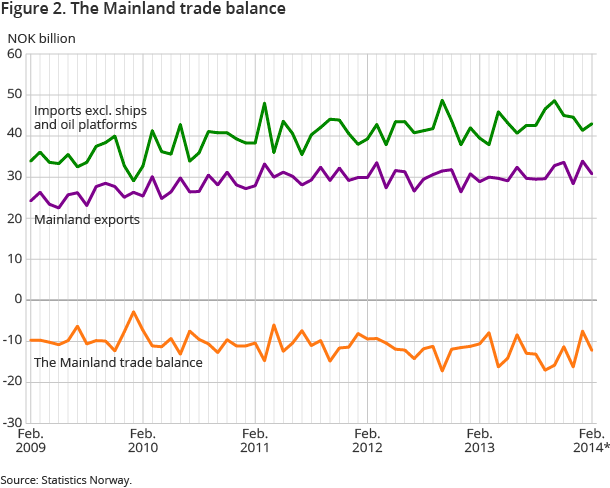
Mainland exports came to approximately NOK 30.8 billion; a 6.6 per cent increase, i.e. NOK 1.9 billion more than in February last year. Most major commodity groups showed a higher export value.
Increased fish exports
Exports of fish rose particularly and amounted to about NOK 5.3 billion - up nearly 30 per cent - NOK 1.2 billion more than in February 2013. Exports of fresh and chilled whole salmon totalled NOK 2.7 billion, which is NOK 710 million more than a year ago. Although export volumes were slightly larger, the increased value was mostly due to the high salmon prices – averaging NOK 47.60 per kg last month compared to NOK 36.40 in February last year. Exports of cod increased as well, and export of fresh and frozen cod amounted to NOK 452 million; NOK 167 million more than last year.
Dried and salted fish etc. had a significant export increase compared to February last year, to a total of NOK 581 million. Fish exports accounted for most of the increased export value within the main group Food.
Increased exports of machinery and transport equipment and chemical products
Exports of Machinery and transport equipment amounted to nearly NOK 7.3 billion; about NOK 1 billion more than in February last year. Most of the increase, i.e. about NOK 600 million, was in the group other vehicles, including aircraft as well as special vessels, and therefore varies widely. Within the same main group, exports of electrical machinery and apparatus rose by NOK 354 million, amounting to nearly NOK 1.6 billion. Export in the main group Chemical products rose by NOK 611 million compared to February 2013 and resulted in an export value of NOK 3.8 billion.
Increased imports for most major commodity groups
Commodity imports in February came to NOK 43 billion; an increase of NOK 2.9 billion compared with February last year. There was an increase in imports in most major commodity groups, except for Miscellaneous manufactured articles and Crude materials. The latter amounted to barely NOK 2.2 billion - a drop of almost 11 per cent compared to February last year. The largest decrease in the main group Crude materials was for metalliferous ores and metal scrap, which totalled an import value of NOK 1.4 billion; roughly 7 per cent lower than in February last year.
Imports of Manufactured goods accounted for nearly NOK 7 billion; a growth of almost 20 per cent compared to February last year. All subgroups increased, with a particular increase in the subgroup manufactures of metals, which rose by NOK 434 million and amounted to over NOK 2.2 billion. Within Chemicals, imports came to NOK 4.1 billion and were NOK 492 million higher than in February last year. Medicinal and pharmaceutical products accounted for more than NOK 1 billion of this import value. The main group Food and live animals increased by NOK 511 million to just over NOK 3.1 billion in February. There was a particularly large increase in imports of fish, which came to NOK 560 million, and this was mostly due to imports of fish from foreign vessels. Within the main group Machinery and transport equipment, imports increased in all subgroups except for the group other transport equipment. The decline in the latter relates to imports of several helicopters in the corresponding month in 2013. The largest growth in the main group Machinery and transport equipment was for industrial machines, which increased by more than NOK 0.5 billion compared to February last year.
Contact
-
Information services external trade
E-mail: utenrikshandel@ssb.no
-
Nina Rolsdorph
E-mail: nina.rolsdorph@ssb.no
tel.: (+47) 41 51 63 78
-
Jan Olav Rørhus
E-mail: jan.rorhus@ssb.no
tel.: (+47) 40 33 92 37
