Content
Published:
Updated:
This is an archived release.
Due to an error, the yearly tables in Statbank were not updated with new figures for 2012 and 2013 after the release of monthly figures for April 2014. These were updated on 16 May at 13:00 hrs.
Strong export of fish continues
The trade surplus in April was NOK 31.6 billion. This was down 0.3 per cent from March but up 31.6 per cent from last April. Fish exports totalled NOK 5.6 billion; NOK 1.2 billion higher than the corresponding period last year.
| NOK Million | Change in per cent | NOK Million - so far this year | Change in per cent - so far this year | ||
|---|---|---|---|---|---|
| April 2014 | March 2014 - April 2014 | April 2013 - April 2014 | April 2014 | April 2013 - April 2014 | |
| 1The figures are marked with the symbol *. This is Statistics Norways standard symbol for indicating preliminary figures. | |||||
| 2Due to the data collection method, the preliminary monthly figures published for ships and oil platforms are often incomplete. In retrospect, therefore, the trade in these goods could in some cases lead to major corrections in the figures. Please see tables 2-4 for the impact these figures have on the external trade. | |||||
| Imports | 43 189 | -7.1 | -5.9 | 174 929 | 4.7 |
| Ships and oil platforms2 | - | -100.0 | -100.0 | 676 | -69.5 |
| Exports | 74 805 | -4.3 | 7.0 | 320 318 | 7.2 |
| Crude oil | 24 882 | 4.1 | 28.2 | 100 174 | 13.1 |
| Natural gas | 18 338 | -16.5 | -9.1 | 86 096 | 0.0 |
| Natural gas condensates | 669 | -1.9 | 24.2 | 3 227 | 5.4 |
| Ships and oil platforms2 | 303 | 39.6 | 203.0 | 3 752 | 135.4 |
| Mainland exports | 30 614 | -2.6 | 3.1 | 127 068 | 6.4 |
| The trade balance | 31 615 | -0.3 | 31.6 | 145 389 | 10.3 |
| The mainland trade balance | -12 575 | 16.0 | 22.3 | -47 185 | -4.1 |
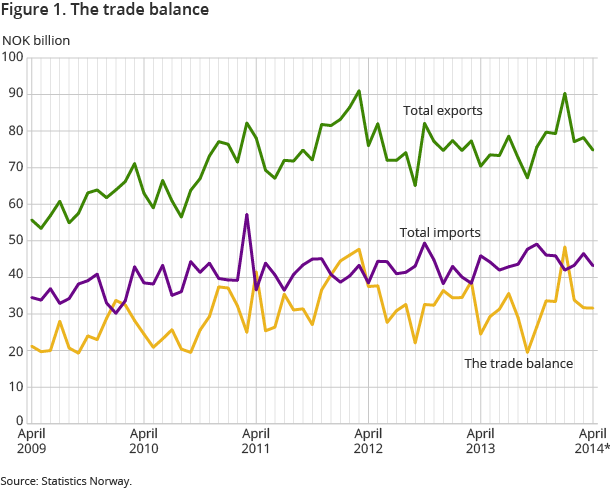
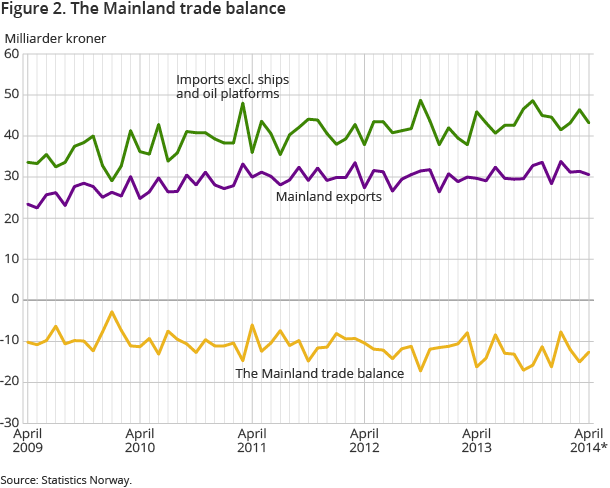
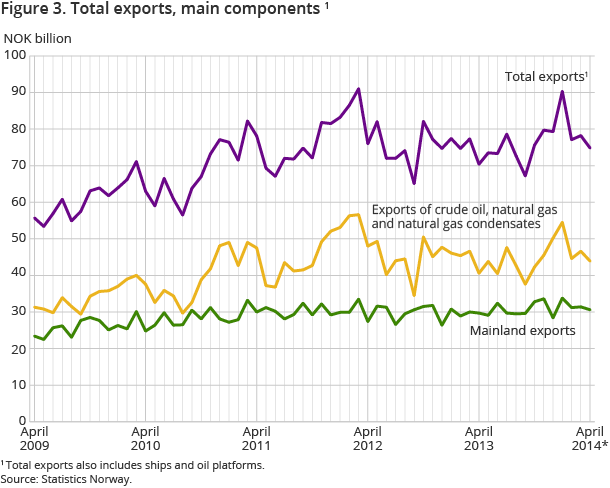
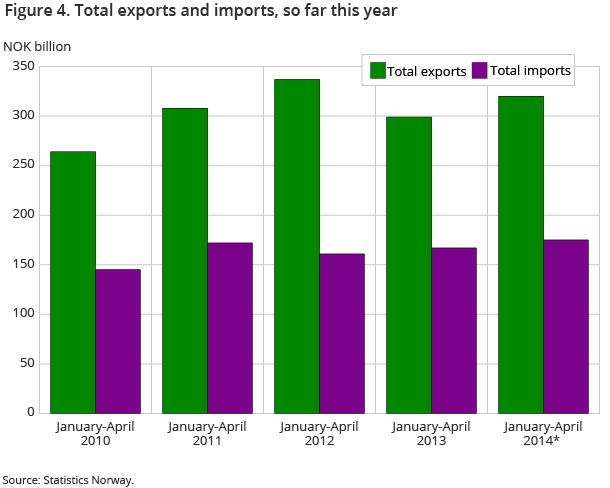
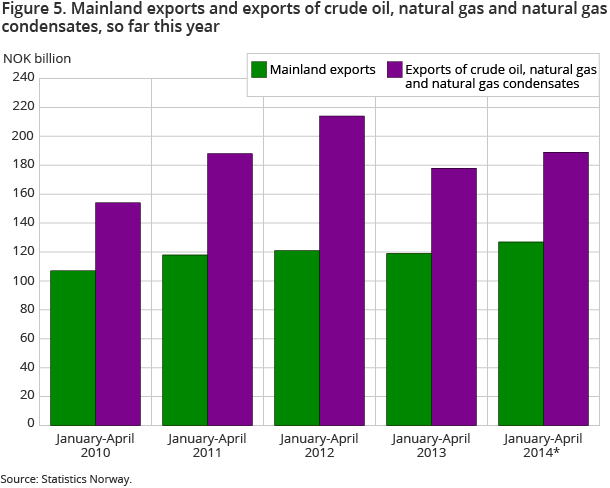
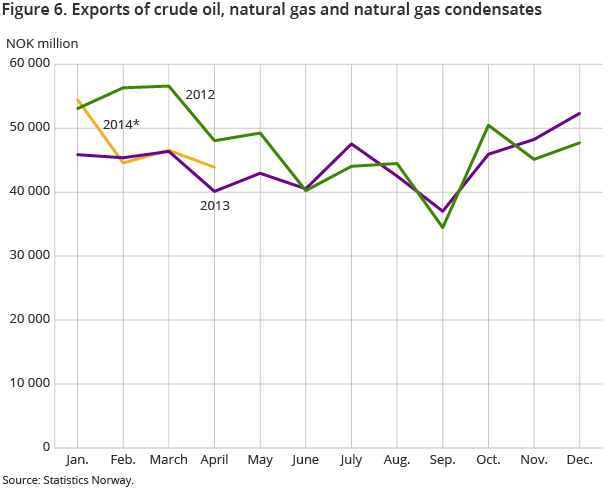
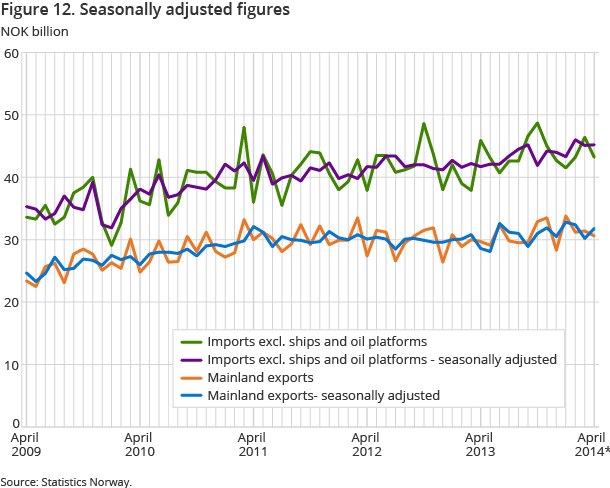
Imported goods totalled NOK 43.2 billion in April; down 7.1 per cent from the previous month, and down 5.9 per cent from last April. Exports came to NOK 74.8 billion; up 7 per cent from last April, but down 4.3 per cent from March 2014. When interpreting rates of change from last April, it should be noted that Easter fell in April this year, while last year it was in March.
Increase in crude oil exports
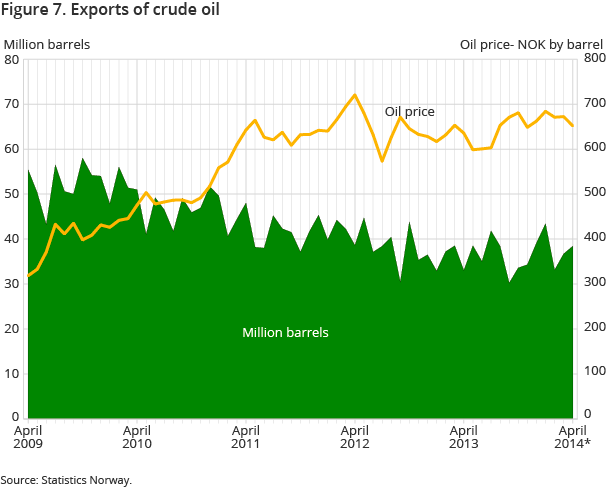
The export value of crude oil was NOK 24.9 billion in April; an increase of 4.1 per cent from March and 28.2 per cent from April last year. The main reason for the increase was a higher exported volume, with 38.4 million barrels in April, while only 33 million barrels were exported in April last year and 36.7 million barrels last month. The mean price of a barrel of crude oil was NOK 648 in April; a decline of NOK 4 from March, but an increase of NOK 60 from April last year.
Natural gas exports declined
NOK 18.3 billion worth of natural gas was exported in April; down 16.5 per cent from the previous month and a decline of 9.1 per cent from April last year. The downturn can be explained by a decrease in both price and volume for natural gas in a gaseous state, of which 8.3 billion cubic metres were exported in April 2014.
Mainland exports increase
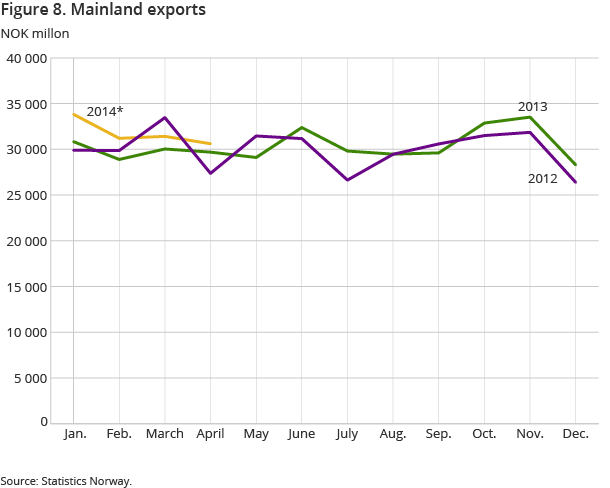
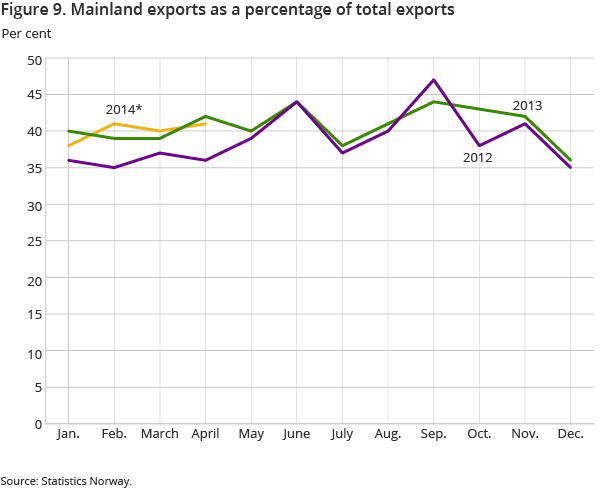
Exports excluding ships, oil platforms, crude oil, natural gas and condensates came to NOK 30.6 billion in April. This was down 2.6 per cent from March, but up 3.1 per cent from April 2013.
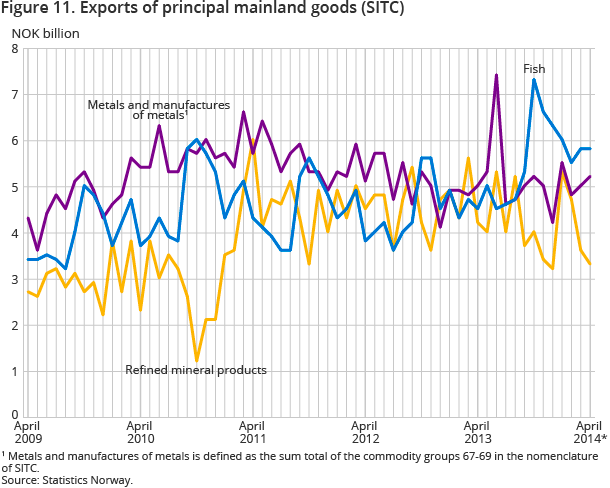
The export value of fish increased by 28.8 per cent compared to April in the previous year, and totalled NOK 5.6 billion. The increase can be explained by an increase in volume and the sustained high price of fresh salmon. About 70 000 tonnes of fresh whole salmon were exported in April, which was almost 13 000 tonnes more than April last year. The average price per kilogram was NOK 45.3.
The export of non-ferrous metals increased by NOK 269 million, to NOK 3.3 billion, while power generating machinery and equipment increased by NOK 268 million to NOK 844 million.
The export of electrical machinery and apparatus declined by NOK 418 million to NOK 930 million. Refined mineral products declined by NOK 829 million to NOK 3.1 billion.
Decline in imports
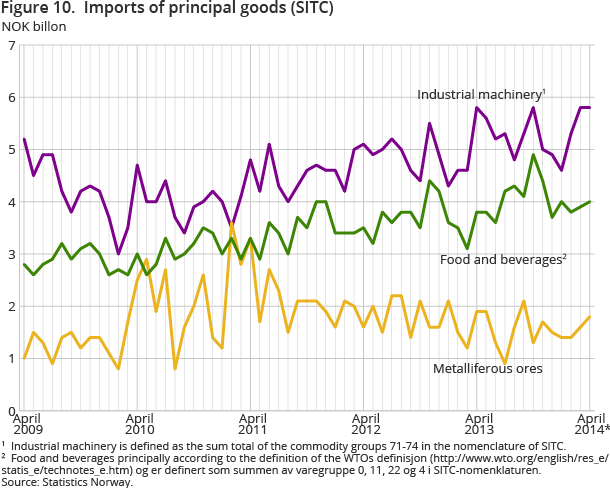
The import of goods totalled NOK 43.2 billion in April 2014; down 5,9 per cent from April last year.
The main group mineral fuels, lubricants and related materials declined by NOK 1.5 billion compared to a year ago. The import value of crude oil was NOK 1.5 billion in April compared to NOK 2.5 billion last April. The imports of electric current fell by NOK 620 million, or 91 per cent, in April compared to the corresponding period in 2013. Imports of road vehicles declined by 12 per cent compared to April last year, and were more than NOK 1 billion less than the record month of March.
The import value came to NOK 4.6 billion in April and a total of 15 000 cars were imported compared to about 18 500 in March and just fewer than 18 400 in April the previous year.
The import of organic chemicals came to NOK 461 million, compared to NOK 872 million a year ago.
There was an increase in the import of other industrial machinery and equipment, up NOK 374 million to NOK 2.8 billion compared to April 2013.
Changes in the external trade statistics for the years 2012 and 2013 Open and readClose
At 10 am on 15 May 2014, Statistic’s Norway’s website ssb.no will be updated with final figures for 2013 and corrected final figures for 2012, see table 14 for main changes.
The changes have also been made in Statbank .
National accounts and balance of payments will be revised for the years 2012 and 2013 in November 2014 and May 2014 respectively.
Change in country of destination for natural gas exportsOpen and readClose
Due to insufficient information about country of destination, changes have been made to the dissemination of the export figures for natural gas. From 2013, country of destination for these figures will be based on the landing point of the pipelines with gas from the Norwegian continental shelf.
Contact
-
Information services external trade
E-mail: utenrikshandel@ssb.no
-
Nina Rolsdorph
E-mail: nina.rolsdorph@ssb.no
tel.: (+47) 41 51 63 78
-
Jan Olav Rørhus
E-mail: jan.rorhus@ssb.no
tel.: (+47) 40 33 92 37
