Content
Published:
This is an archived release.
Lowest trade surplus in ten years
The trade surplus in June 2014 amounted to NOK 17.8 billion; 43.2 per cent lower than in the same month last year. This is the lowest surplus since 2004. Less oil and gas exports are the main reason for the decline.
| NOK Million | Change in per cent | NOK Million - so far this year | Change in per cent - so far this year | ||
|---|---|---|---|---|---|
| June 2014 | May 2014 - June 2014 | June 2013 - June 2014 | June 2014 | June 2013 - June 2014 | |
| 1The figures are marked with the symbol *. This is Statistics Norways standard symbol for indicating preliminary figures. | |||||
| 2Due to the data collection method, the preliminary monthly figures published for ships and oil platforms are often incomplete. In retrospect, therefore, the trade in these goods could in some cases lead to major corrections in the figures. Please see tables 2-4 for the impact these figures have on the external trade. | |||||
| Imports | 45 132 | 1.5 | 7.4 | 265 302 | 4.8 |
| Ships and oil platforms2 | - | -100.0 | -100.0 | 1 348 | -70.1 |
| Exports | 62 942 | -10.8 | -14.3 | 453 893 | 2.0 |
| Crude oil | 19 287 | -6.3 | -9.6 | 140 046 | 5.4 |
| Natural gas | 13 101 | -21.8 | -30.3 | 115 941 | -6.6 |
| Natural gas condensates | 331 | -44.5 | -15.1 | 4 155 | -2.0 |
| Ships and oil platforms2 | - | . | -100.0 | 4 039 | 49.1 |
| Mainland exports | 30 222 | -7.3 | -6.7 | 189 712 | 4.8 |
| The trade balance | 17 810 | -31.7 | -43.2 | 188 591 | -1.6 |
| The mainland trade balance | -14 910 | -25.7 | -78.3 | -74 242 | -9.6 |
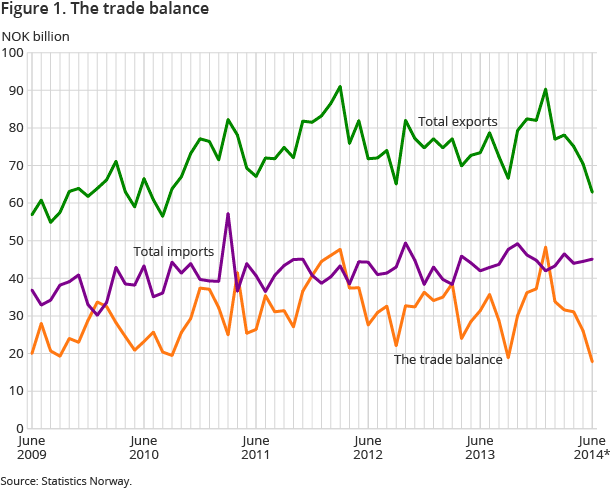
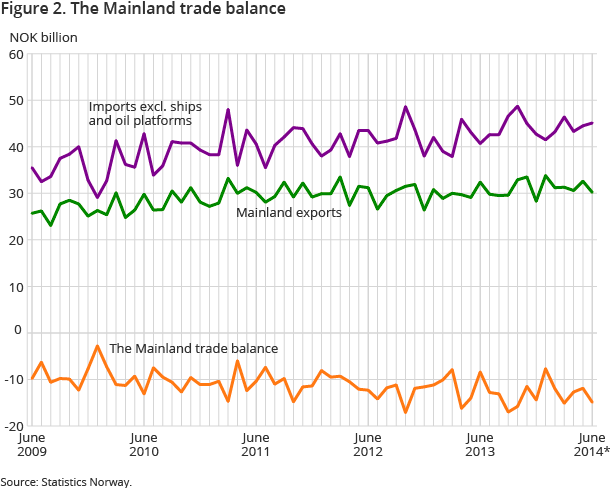
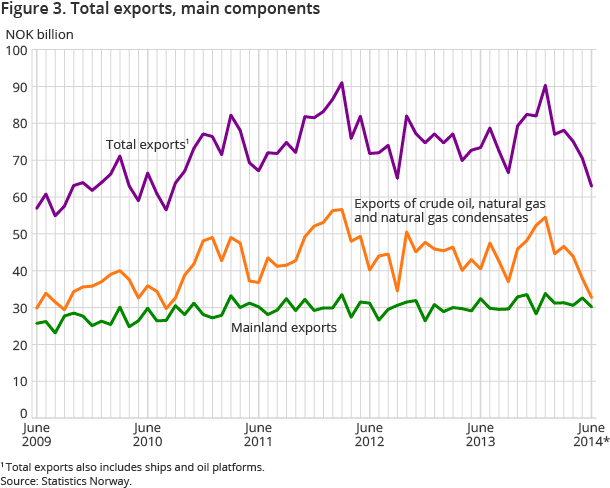
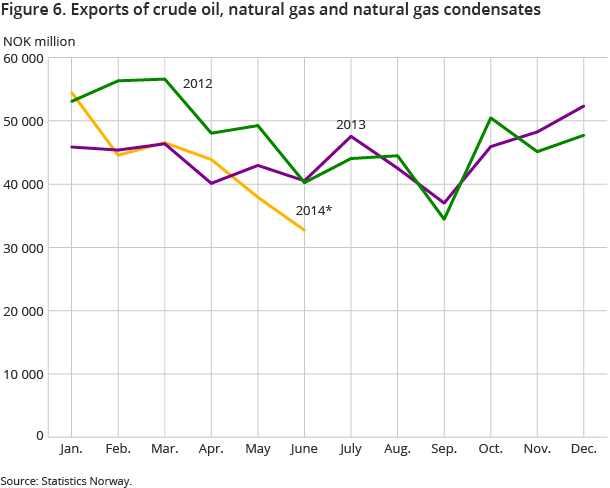
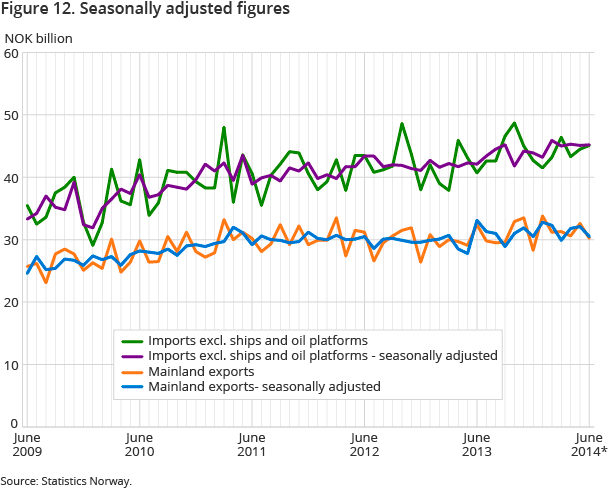
In June, exports of goods came to nearly NOK 63 billion; a decrease of 14.3 per cent compared to the same month last year. The decline was mainly due to less exports of crude oil and natural gas, which respectively fell by 9.6 and 30.3 per cent. At the same time, imports rose in June by 7.4 per cent, to just over NOK 45 billion. Combined, this led to the lowest trade surplus in ten years.
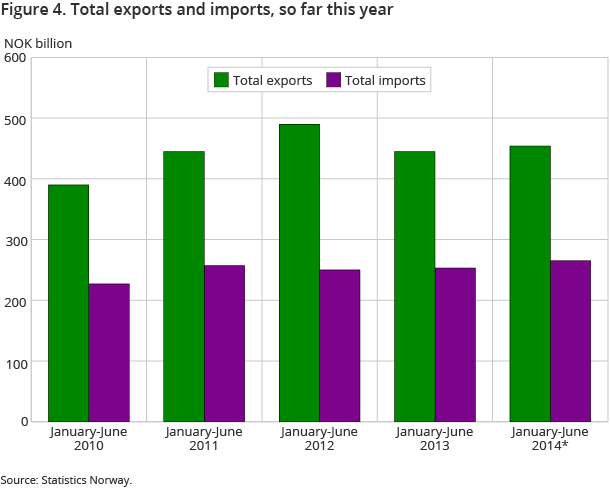
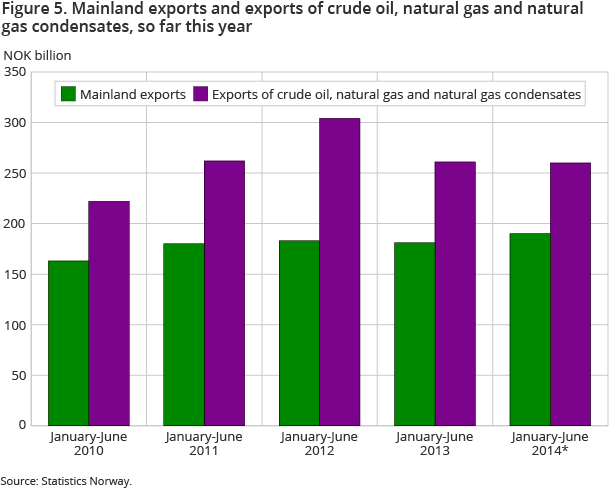
The trade surplus for the first six months, however, amounted to NOK 188.6 billion, thus ending only 1.6 per cent lower than in the same period last year. Mainland exports increased by 4.8 per cent in the same period – ending at NOK 189.7 billion.
Exports increased by 2 per cent in the first half of 2014 and amounted to NOK 454 billion. Imports rose by 4.8 per cent in the same period and reached over NOK 265 billion. The value of crude oil exports went up by 5.4 per cent in the first six months of the year compared with the corresponding period in 2013. In the same period, exports of natural gas fell by 6.6 per cent, largely due to falling prices. Export of fish on the other hand, increased by nearly 20 per cent compared to the first half of 2013, and fish to the value of NOK 32 billion was exported.
Less exports of crude oil
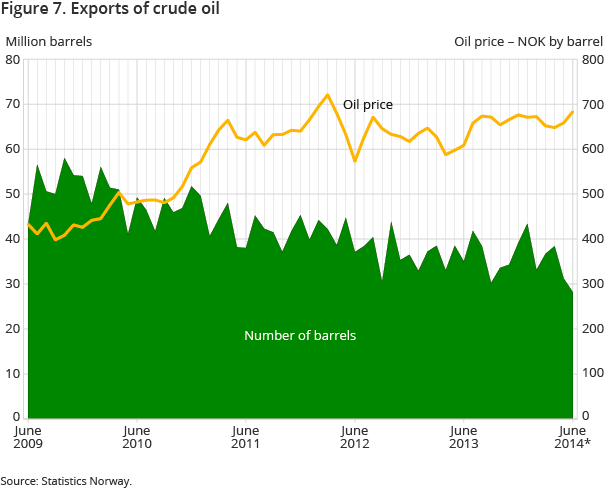
In June, Norway exported more than 28 million barrels of crude oil. This was nearly 7 million barrels less than in the same month last year. Although maintenance work is common on the oil platforms during summer months, monthly volumes have not been lower than 30 million barrels for a very long period of time. Despite this, the export value came out relatively high due to rising oil prices (NOK 684 per barrel in June, compared to NOK 609 in June last year) and amounted to NOK 19.3 billion, which is about NOK 2 billion less than in June 2013.
Aggregated figures for the first half of 2014 show an export quantity of 211 million barrels of crude oil compared to about 215 million barrels in the same period last year. On average for the first six months of the year, the oil price was NOK 46 higher per barrel in 2014 than in the same period in 2013, thus resulting in an increased export value despite lower export volumes. Exports of crude oil amounted to NOK 140 billion in the first half of 2014 to NOK 133 billion in the same period in 2013.
Less exports of natural gas
The value of exported natural gas fell to NOK 13.1 billion. The majority of this was natural gas in a gaseous state, which fell by 26 per cent to just over NOK 13 billion in June, which is NOK 4.7 billion less than the year before. The decline was primarily due to declining gas prices; averaging NOK 2.22 per standard cubic metre in June 2013 compared to NOK 1.83 this year. A total of 7.1 billion standard cubic metres of natural gas was exported in June. This is about 850 million standard cubic metres less than in the same month last year. Lower prices also impacted the impairment in the first half of 2014, although exported volumes were lower compared to the same period a year back. Exports of natural gas in a gaseous state in the first half of 2014 amounted to NOK 108 billion, while in 2013 exports totalled NOK 120 billion during the same period.
Impaired mainland exports in June
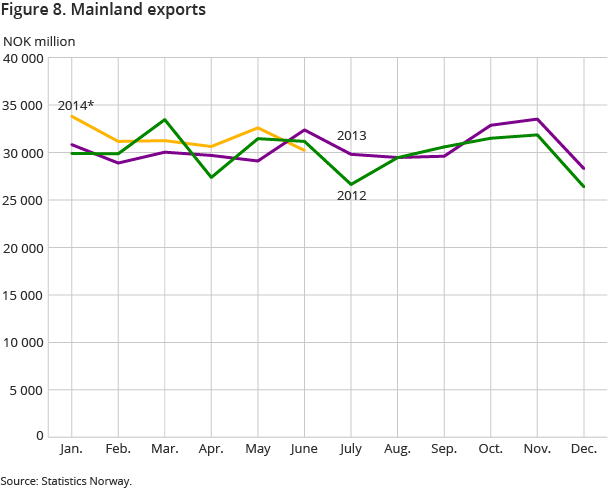
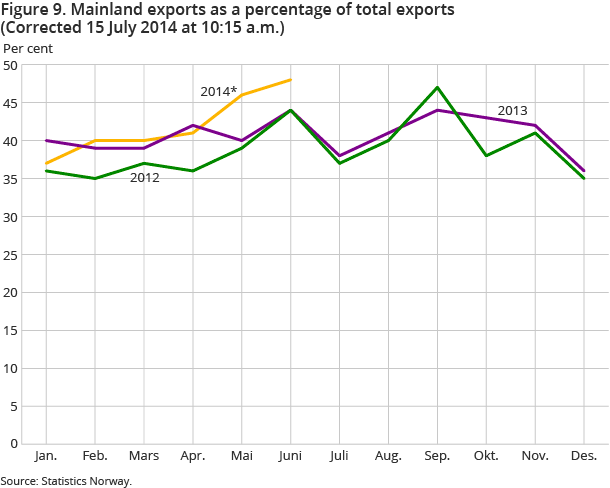
Mainland exports came to approximately NOK 30.2 billion. The decline, compared to the same month last year, was 6.7 per cent, and amounted to almost NOK 2.2 billion. Mainland exports increased by 4.8 per cent in the first half of 2014 compared to the first six months of the previous year.
Increased exports of fish and chemical products
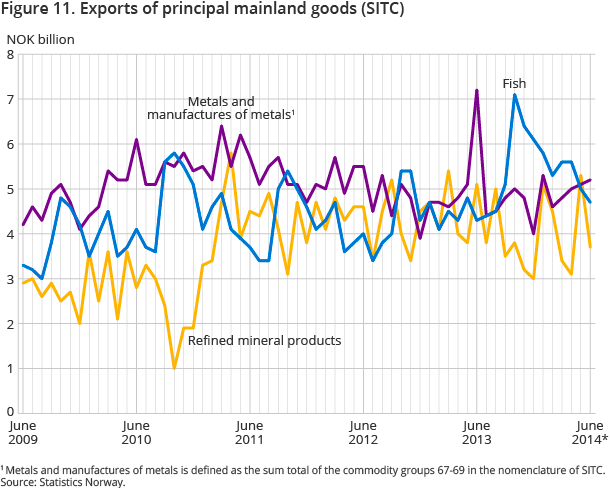
Exports of most major commodity groups fell in June compared to the same month last year. An exception was the main group fish. In June, exports of fish and fish products totalled NOK 4.7 billion; 10 per cent higher than in the same month last year. In particular, exports of salmon and cod rose. Although the average export price for fresh salmon was NOK 36.30 in June, which is NOK 4.60 less than in June last year, higher volumes exported made an impact on the total value. Approximately 69 000 tonnes of fresh whole salmon were exported in June; nearly 11 000 tonnes more than in June 2013. Export volumes increased for all salmon products in June compared to the same month in 2013. In the first half of 2014, exports of fish amounted to nearly NOK 32 billion. This is an increase of NOK 5.3 billion compared to the same period a year ago - around 20 per cent.
Figures for June as well as for the first half of 2014 showed an increase in exports of most commodity groups within the main group chemical products. The group medicines and pharmaceutical products was particularly high, and exports came to nearly NOK 3 billion in the first half of 2014. This represents an increase of 32 per cent from the same period last year.
The main group manufactured goods fell by almost 25 per cent compared with June last year, however figures for the first half-year are not divergent. Exports within the commodity groups iron and steel and non ferrous metals increased both in June and in the first half year of 2014 compared to the same periods last year. In the group non-ferrous metal, the rise was mainly for aluminium and nickel and exports of the commodity group increased by nearly 16 per cent compared with June last year. Figures for the first half-year of 2014 show that the export value for this commodity group amounted to nearly NOK 20 billion. Within the main group mineral fuels, exports of refined petroleum products declined, both in June and in the first half of 2014 compared to the same periods last year. Exports in June amounted to NOK 3.7 billion, which is NOK 1.4 billion lower than in the same month last year and a fall of NOK 1.9 billion when comparing the first six months of 2014 with corresponding months in 2013.
Increased imports of most major groups
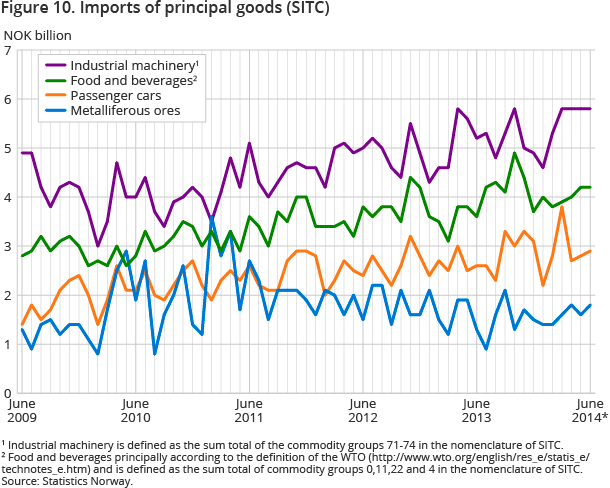
Commodity imports totalled just over NOK 45 billion in June 2014, about NOK 3 billion higher than the same month last year. With the exception of fuels, imports increased in all major commodity groups. Imports of refined petroleum products accounted for a larger share of the decline of fuels and fell by nearly NOK 61 million compared with the same month in 2013. Import figures for the first half showed a similar tendency for the main commodity group with a drop of almost 18 per cent - down NOK 3.2 billion to NOK 14.9 billion. Refined petroleum products accounted for NOK 1.2 billion of this decrease.
Increased imports of crude materials and iron and steel
Imports increased by NOK 563 million in June for the main commodity group crude materials compared to the same month in the previous year. Imports of the commodity group metalliferous ores and metal scrap increased specifically and import values came to NOK 1.8 billion in June – NOK 488 million more than June last year. However, aggregated figures for the six first months of the year do not show any major changes. The commodity group metalliferous ores and metal scrap fell by NOK 400 million and came to NOK 9.6 billion. In the same main commodity group, imports of iron and steel rose to NOK 1.4 billion in June; an increase of NOK 334 million compared to the same month last year. Imports of iron and steel also increased overall in the first six months of 2014. Imports came to NOK 7.8 billion, which is more than NOK 1 billion more than last year's first six months.
Increase in imports of machinery
Imports of the commodity group general industrial machinery and equipment rose particularly in the first six months of 2014 compared to the same period last year and imports rose to NOK 16 billion - NOK 2.2 billion more than in the same period last year. There was also a marked increase in imports of electrical machinery of NOK 1.8 billion to just under NOK 14.5 billion in the last six months compared to the same period in 2013. In the same main commodity group, imports of other transport equipment fell by NOK 4.9 billion in the first six months of 2014 compared to the same period in the previous year. This product group includes ships and aircraft and values vary considerably from one period to another.
Increased exports to Europe and Asia
Aside from oil and natural gas, exports increased to all continents except Africa in the first half of 2014 compared to the same period last year. Mainland exports to EU countries increased by 6.5 per cent and there were higher values for most of the major trading partners. Exports also increased to the crisis-hit countries in southern Europe in the first half-year. Mainland exports of goods to Asia rose by 6.7 per cent in the last six months compared to the same period last year. There were particularly large increases in exports to Japan, China and Singapore.
Contact
-
Information services external trade
E-mail: utenrikshandel@ssb.no
-
Nina Rolsdorph
E-mail: nina.rolsdorph@ssb.no
tel.: (+47) 41 51 63 78
-
Jan Olav Rørhus
E-mail: jan.rorhus@ssb.no
tel.: (+47) 40 33 92 37
